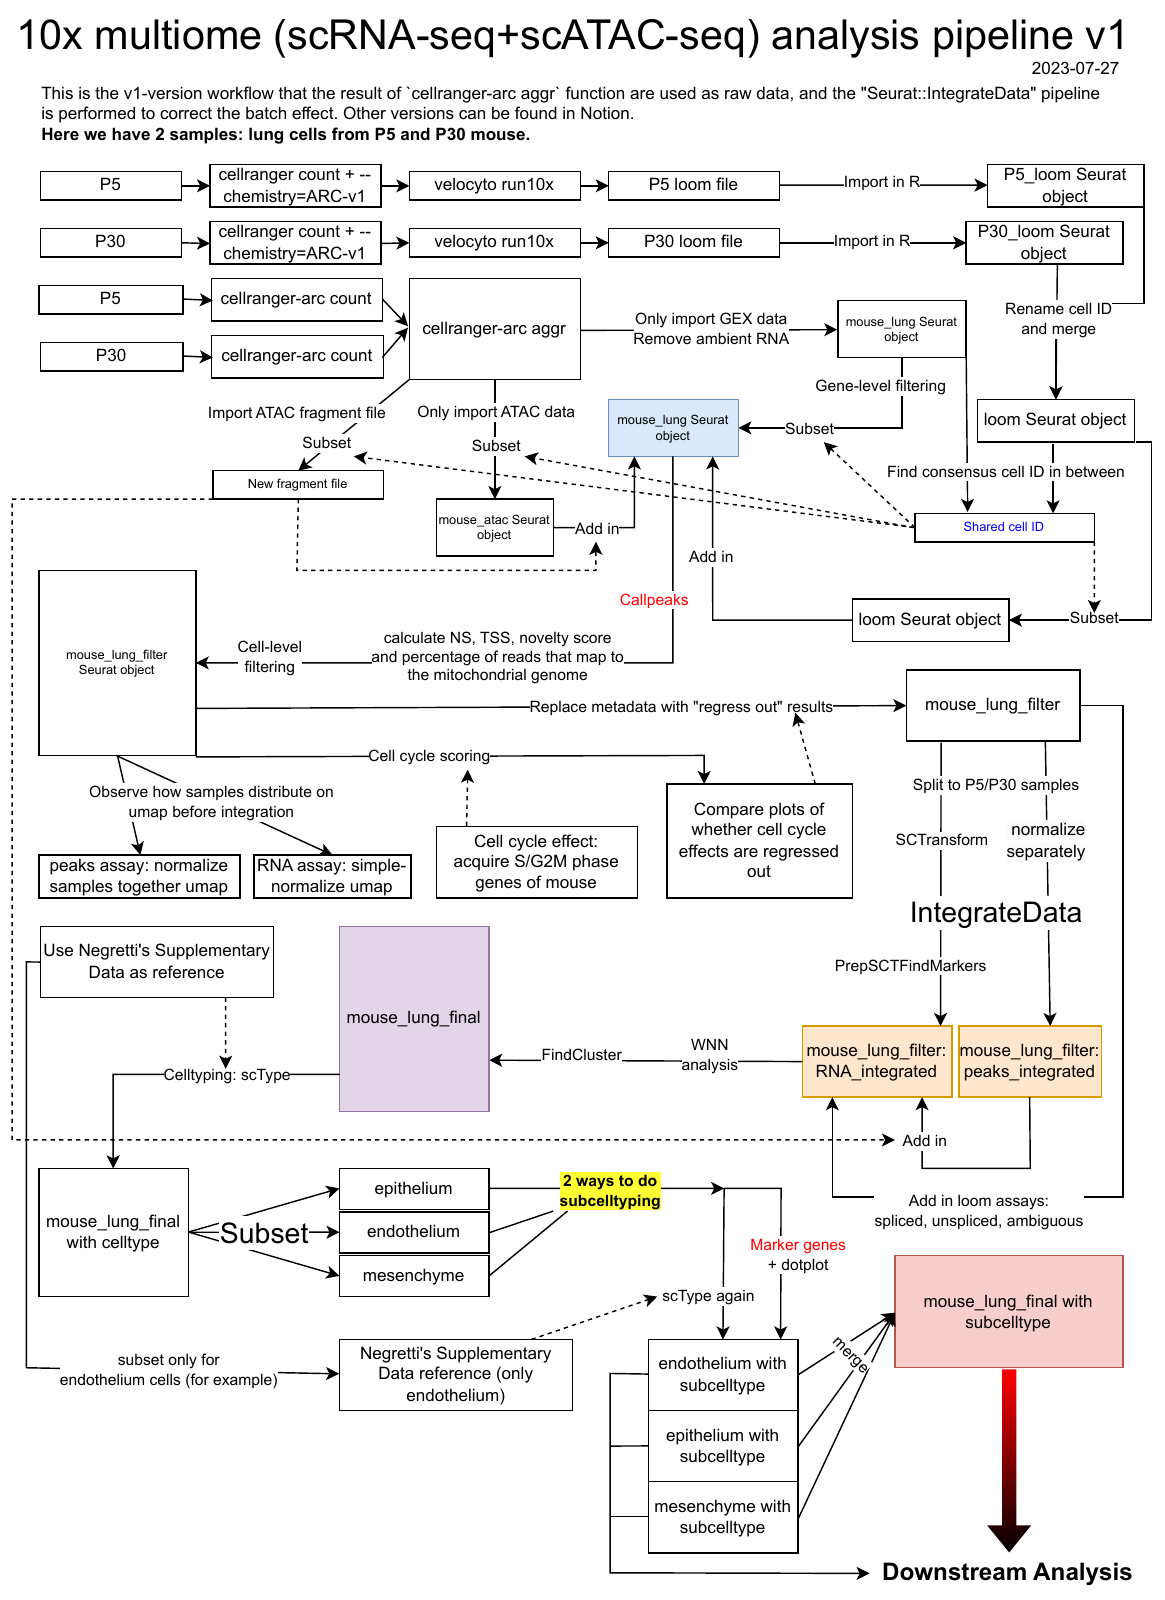
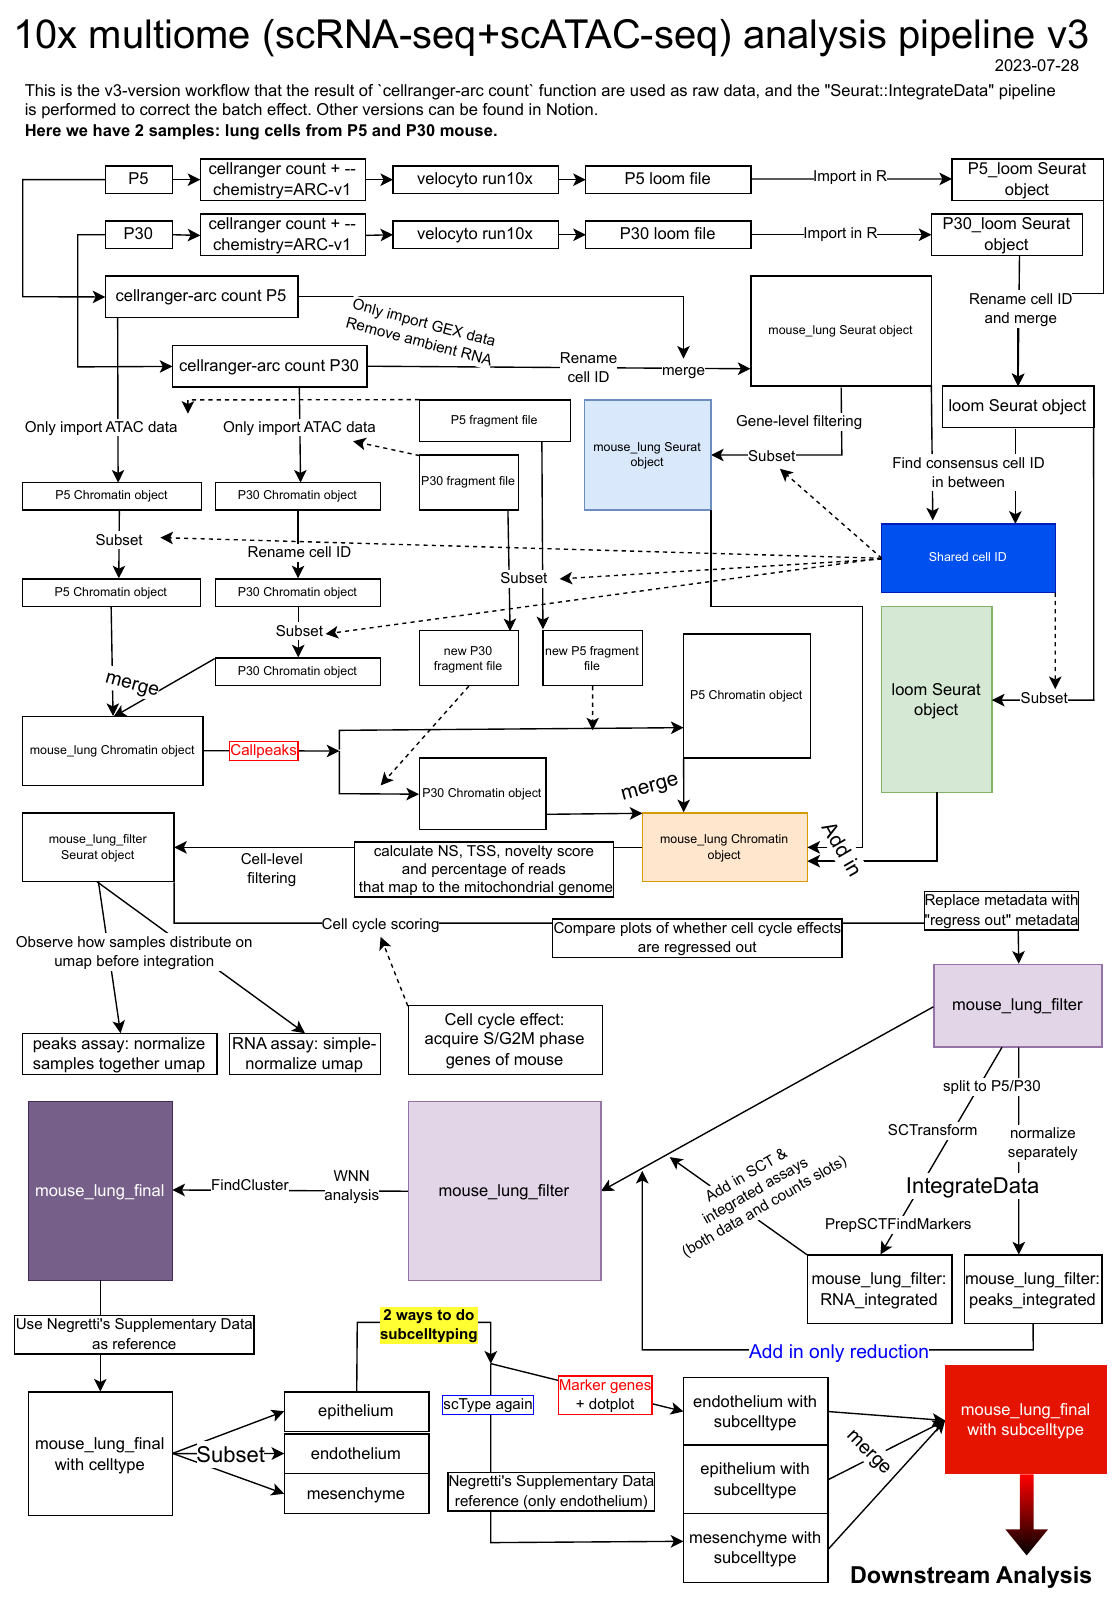
It took me 8+ months to finish the draft of the general pipelines. Afterwards, I optimized the pipeline to v3 version by comparing the results of different pipelines. However, as Seurat has already been updated to Seurat-v5, code might have to be modified before usage.
v1 version
v3 version
An integrated workflow to perform four v1-v4 version pipelines AT ONCE:
I previously developed four pipelines (v1–v4). This integrated workflow runs all four on new data so their results can be compared directly.
Compare the following workflows at once
- v1 - cellranger-arc aggr + IntegrateData
- v2 - cellranger-arc aggr + not IntegrateData
- v3 - cellranger-arc count*2 + IntegrateData
- v4 - cellranger-arc count*2 + not IntegrateData
Library and functions
library(Matrix)
library(Seurat)
library(Signac)
library(EnsDb.Mmusculus.v79)
library(dplyr)
library(tidyr)
library(ggplot2)
library(biovizBase)
library(RCurl)
library(AnnotationHub)
library(SoupX)
library(ExperimentHub)
library(SingleCellExperiment)
library(monocle3)
library(scuttle)
library(celldex)
library(scran)
library(viridis)
library(HGNChelper)
library(ggraph)
library(openxlsx)
library(metap)
library(purrr)
library(tibble)
library(velocyto.R)
library(SeuratWrappers)
library(stringr)

# load gene set preparation function
source("<https://raw.githubusercontent.com/IanevskiAleksandr/sc-type/master/R/gene_sets_prepare.R>")

# load cell type annotation function
source("<https://raw.githubusercontent.com/IanevskiAleksandr/sc-type/master/R/sctype_score_.R>")
SoupX remove ambient RNA (with cluster info in outs data produced by cellranger)
runSoupX <- function(raw_counts, filtered_counts, mat_out_path){
  in_soup <- SoupChannel(tod = raw_counts[rownames(raw_counts) != "Gm42418",],
                         toc = filtered_counts[rownames(filtered_counts) != "Gm42418",],
                         metaData = NULL,
                         soupRange = c(0, 10),
                         keepDroplets = FALSE)
  # Gm42418 is a rRNA contaminant - remove it now

  sr_obj <- CreateSeuratObject(in_soup$toc)

  # Fast preliminary clustering and normalization for soupx run
  sr_obj <- NormalizeData(sr_obj)
  sr_obj <- FindVariableFeatures(sr_obj)
  sr_obj <- ScaleData(sr_obj)
  sr_obj <- RunPCA(sr_obj,pcs.compute=30)
  sr_obj <- RunUMAP(sr_obj,dims=1:15)
  sr_obj <- FindNeighbors(sr_obj,dims=1:15)
  sr_obj <- FindClusters(sr_obj,resolution=1.2)
  sr_DF <-  as.data.frame(sr_obj@reductions$umap@cell.embeddings)
  colnames(sr_DF) <- c('RD1','RD2')
  sr_DF$Cluster <- factor(sr_obj@meta.data[rownames(sr_DF),'RNA_snn_res.1.2'])

  #Specify background RNA genes
  background_RNA_genes <- c("Dcn", "Bgn", "Aspn", "Ecm2", "Fos", "Hbb-bs", "Hbb-bt", "Hba-a1", "Hba-a2", "Lyz1", "Lyz2", "Mgp", "Postn", "Scgb1a1")

  #Specify background RNA genes for epithelial specific cell sort
  est_expression <- estimateNonExpressingCells(in_soup,
                                               list(SLRP = background_RNA_genes),
                                               clusters = setNames(sr_DF$Cluster, rownames(sr_DF)),
                                               FDR = 0.05,
                                               maximumContamination = 1.5)

  ## calculate contamination and adjust the counts.
  in_soup <- setClusters(in_soup, sr_DF$Cluster)
  in_soup <- calculateContaminationFraction(in_soup, list(SLRP = background_RNA_genes), useToEst = est_expression, forceAccept = TRUE)
  head(in_soup$metaData)

  ## adjust the counts based on contamination fraction
  ## Return dgCMatrix
  #return(adjustCounts(in_soup, roundToInt = TRUE))
  adj_counts <- adjustCounts(in_soup)
  Matrix::writeMM(adj_counts, file = paste0(mat_out_path))
  return(adj_counts)
}
Import loom file
P5_loom_raw <- ReadVelocity(file = "###")
P5_loom_raw <- as.Seurat(x = P5_loom_raw)

P30_loom_raw <- ReadVelocity(file = "###")
P30_loom_raw <- as.Seurat(x = P30_loom_raw)
v1 and v2 raw data process
Import RNA assay and remove ambient RNA
mouse_lung_aggr <-
  runSoupX(
    Read10X_h5("###")$`Gene Expression`,
    Read10X_h5("###")$`Gene Expression`,
            "###")

mouse_lung_aggr <- CreateSeuratObject(counts = mouse_lung_aggr)

# 確認去除 Gm42418 gene
# rownames(mouse_lung@assays$RNA)[grep("^Gm42418", rownames(mouse_lung_aggr@assays$RNA), perl = TRUE)]
Gene-level filtering
DefaultAssay(mouse_lung_aggr) <- "RNA"

counts <- GetAssayData(object = mouse_lung_aggr, slot = "counts")
nonzero <- counts > 0

keep_genes <- Matrix::rowSums(nonzero) >= 10
filtered_counts <- counts[keep_genes, ]

mouse_lung_aggr <- CreateSeuratObject(filtered_counts, meta.data = mouse_lung_aggr@meta.data)
Process the cell ID in loom file
# 把 "P5_scRNA:" 去除
P5_loom_v1andV2 <- RenameCells(P5_loom_raw,
                             new.names = gsub(pattern = "^P5_scRNA:",
                                              replacement = "",
                                              colnames(P5_loom_raw))
)

# 把 "x" 改成 "-1"
P5_loom_v1andV2 <- RenameCells(P5_loom_v1andV2,
                             new.names = gsub(pattern = "x$",
                                              replacement = "-1",
                                              colnames(P5_loom_v1andV2))
)

# 檢查
#colnames(P5_loom_v1andV2)[1:10]


#### P30
# 把 "P30_scRNA:" 去除
P30_loom_v1andV2 <- RenameCells(P30_loom_raw,
                             new.names = gsub(pattern = "^P30_scRNA:",
                                              replacement = "",
                                              colnames(P30_loom_raw))
)

# 把 "x" 改成 "-2"
P30_loom_v1andV2 <- RenameCells(P30_loom_v1andV2,
                             new.names = gsub(pattern = "x$",
                                              replacement = "-2",
                                              colnames(P30_loom_v1andV2))
)

# 檢查
#colnames(P30_loom_v1andV2)[1:10]

loom_v1andV2 <- merge(P5_loom_v1andV2,P30_loom_v1andV2)
Find consensus cell ID between loom and Seurat object
# remove Gm42418 feature in loom file so the feature numbers is same as seurat RNA assays
counts <- GetAssayData(loom_v1andV2, assay = "spliced")
counts <- counts[-(which(rownames(counts) %in% c('Gm42418'))),]
loom_v1andV2 <- subset(loom_v1andV2, features = rownames(counts))


#  loom  與 seurat object 的 cell number 不一樣,而我只想要留下共同的 cell ID
# Pull cell names
CellID_seu <- colnames(mouse_lung_aggr)
CellID_loom <- colnames(loom_v1andV2)

# Identify shared cells between both objects
shared_cellIDs_V1andV2 <- intersect(x = CellID_seu, y = CellID_loom)

# filter both loom and seurat object
mouse_lung_aggr$cells <- colnames(mouse_lung_aggr)
mouse_lung_aggr <- subset(mouse_lung_aggr,
               subset = cells %in% shared_cellIDs_V1andV2)

loom_v1andV2$cells <- colnames(loom_v1andV2)
loom_v1andV2 <- subset(loom_v1andV2,
               subset = cells %in% shared_cellIDs_V1andV2)
Add loom to the Seurat object
counts slot
mouse_lung_aggr[["spliced"]] <- CreateAssayObject(counts = GetAssayData(object =  loom_v1andV2,
                                                            assay = "spliced",
                                                            slot = 'counts'))
mouse_lung_aggr[["unspliced"]] <- CreateAssayObject(counts = GetAssayData(object =  loom_v1andV2,
                                                            assay = "unspliced",
                                                            slot = 'counts'))
mouse_lung_aggr[["ambiguous"]] <- CreateAssayObject(counts = GetAssayData(object =  loom_v1andV2,
                                                            assay = "ambiguous",
                                                            slot = 'counts'))
Import ATAC assay and callpeaks
# the 10x hdf5 file contains both data types
# extract ATAC data
atac_counts <- Read10X_h5("###")$Peaks


# filter cell ID
atac_counts_filter <- atac_counts[,shared_cellIDs_V1andV2]


# Now add in the ATAC-seq data
grange.counts <- StringToGRanges(rownames(atac_counts_filter), sep = c(":", "-"))
# we'll only use peaks in standard chromosomes
grange.use <- seqnames(grange.counts) %in% standardChromosomes(grange.counts)
atac_counts_filter <- atac_counts_filter[as.vector(grange.use), ]


annotations <- GetGRangesFromEnsDb(ensdb = EnsDb.Mmusculus.v79)
seqlevelsStyle(annotations) <- 'UCSC'
genome(annotations) <- "mm10"


# filter cell ID in fragment file
Signac::FilterCells(
  fragments = "###",
  cells = shared_cellIDs_V1andV2,
  outfile = "###")

frag.file_filter_V1andV2 <- "###"


# add Chromatin Assay in seurat object
mouse_lung_aggr[["ATAC"]]  <- CreateChromatinAssay(
   counts = atac_counts_filter,
   sep = c(":", "-"),
   genome = 'mm10',
   fragments = frag.file_filter_V1andV2,
   min.cells = 10,
   annotation = annotations
 )


####### Callpeaks
DefaultAssay(mouse_lung_aggr) <- "ATAC"
mouse_lung_aggr@meta.data$sample <- NA
mouse_lung_aggr$cells <- colnames(mouse_lung_aggr)
mouse_lung_aggr@meta.data$sample[which(str_detect(mouse_lung_aggr@meta.data$cells, "-1$"))] <- "P5"
mouse_lung_aggr@meta.data$sample[which(str_detect(mouse_lung_aggr@meta.data$cells, "-2$"))] <- "P30"

# call peaks using MACS2
peaks_V1andV2 <- CallPeaks(mouse_lung_aggr,
									macs2.path = "/data/core/jordan/CondaEnv/macs2/bin/macs2",
									group.by = "sample",
									combine.peaks = TRUE)

# remove peaks on nonstandard chromosomes and in genomic blacklist regions
peaks_V1andV2 <- keepStandardChromosomes(peaks_V1andV2, pruning.mode = "coarse")
peaks_V1andV2 <- subsetByOverlaps(x = peaks_V1andV2, ranges = blacklist_mm10, invert = TRUE)

# Filter out bad peaks based on length
peakwidths <- width(peaks_V1andV2)
peaks_V1andV2 <- peaks_V1andV2[peakwidths  < 10000 & peakwidths > 20]


# quantify counts in each peak
macs2_counts_V1andV2 <- FeatureMatrix(fragments = Fragments(mouse_lung_aggr),
														  features = peaks_V1andV2,
														  cells = colnames(mouse_lung_aggr))

# create a new assay using the MACS2 peak set and add it to the Seurat object
mouse_lung_aggr[["peaks"]] <- CreateChromatinAssay(counts = macs2_counts_V1andV2,
																						  fragments = frag.file_filter_V1andV2,
																						  annotation = annotations)
Calculate NS, TSS, novelty score and percentage of reads that map to the mitochondrial genome
DefaultAssay(mouse_lung_aggr) <- "peaks"

# Calculate the strength of the nucleosome signal per cell. Computes the ratio of fragments between 147 bp and 294 bp (mononucleosome) to fragments < 147 bp (nucleosome-free)
mouse_lung_aggr <- NucleosomeSignal(mouse_lung_aggr)
mouse_lung_aggr$nucleosome_group <- ifelse(mouse_lung_aggr$nucleosome_signal > 1, 'NS > 1', 'NS < 1')
FragmentHistogram(object = mouse_lung_aggr, group.by = 'nucleosome_group', region = 'chr1-1-10000000')


# Compute the transcription start site (TSS) enrichment score for each cell
mouse_lung_aggr <- TSSEnrichment(mouse_lung_aggr, fast = FALSE)
mouse_lung_aggr$high.tss <- ifelse(mouse_lung_aggr$TSS.enrichment > 2.5, 'High', 'Low')
TSSPlot(mouse_lung_aggr, group.by = 'high.tss', assay = 'peaks') + NoLegend()


####
# calculate novelty score 並且另外把metadata移出來
mouse_lung_aggr$log10GenesPerUMI <- log10(mouse_lung_aggr$nFeature_RNA) / log10(mouse_lung_aggr$nCount_RNA)

# The percentage of reads that map to the mitochondrial genome
mouse_lung_aggr[["percent.mt"]] <- PercentageFeatureSet(mouse_lung_aggr, assay = "RNA", pattern = "^mt-")
mouse_lung_aggr$percent.mt <- mouse_lung_aggr$percent.mt/100
Cell-level filtering
mouse_lung_aggr_filter <- subset(
  x = mouse_lung_aggr,
  subset =
    nCount_peaks < 70000 &
    nCount_peaks > 500 &

    nCount_RNA > 500 &
    nCount_RNA < 8000 &
		nFeature_RNA > 200 &
    nFeature_RNA < 4000 &

		log10GenesPerUMI > 0.9 &
    percent.mt < 0.4 &
    percent.mt > 0.005 &

    nucleosome_signal < 1 &
    TSS.enrichment > 2.5
)

# after filtering:  ->  cells
Observe batch effect in RNA assay?
DefaultAssay(mouse_lung_aggr_filter) <- "RNA"

mouse_lung_aggr_filter <- NormalizeData(object =  mouse_lung_aggr_filter)
mouse_lung_aggr_filter <- FindVariableFeatures(object =  mouse_lung_aggr_filter, nfeatures = 16000)
mouse_lung_aggr_filter <- ScaleData(object =  mouse_lung_aggr_filter)
mouse_lung_aggr_filter <- RunPCA(object =  mouse_lung_aggr_filter)

#ElbowPlot(mouse_lung_aggr_filter) # 1:20 is enough

mouse_lung_aggr_filter <- RunUMAP(object =  mouse_lung_aggr_filter,
                             dims = 1:50,
                             umap.method = "uwot")
DimPlot(mouse_lung_aggr_filter,
        reduction = "umap",
        group.by = "sample") +
  ggtitle("RNA assay: simple-normalize umap of v1 and v2 (cellranger-arc aggr)")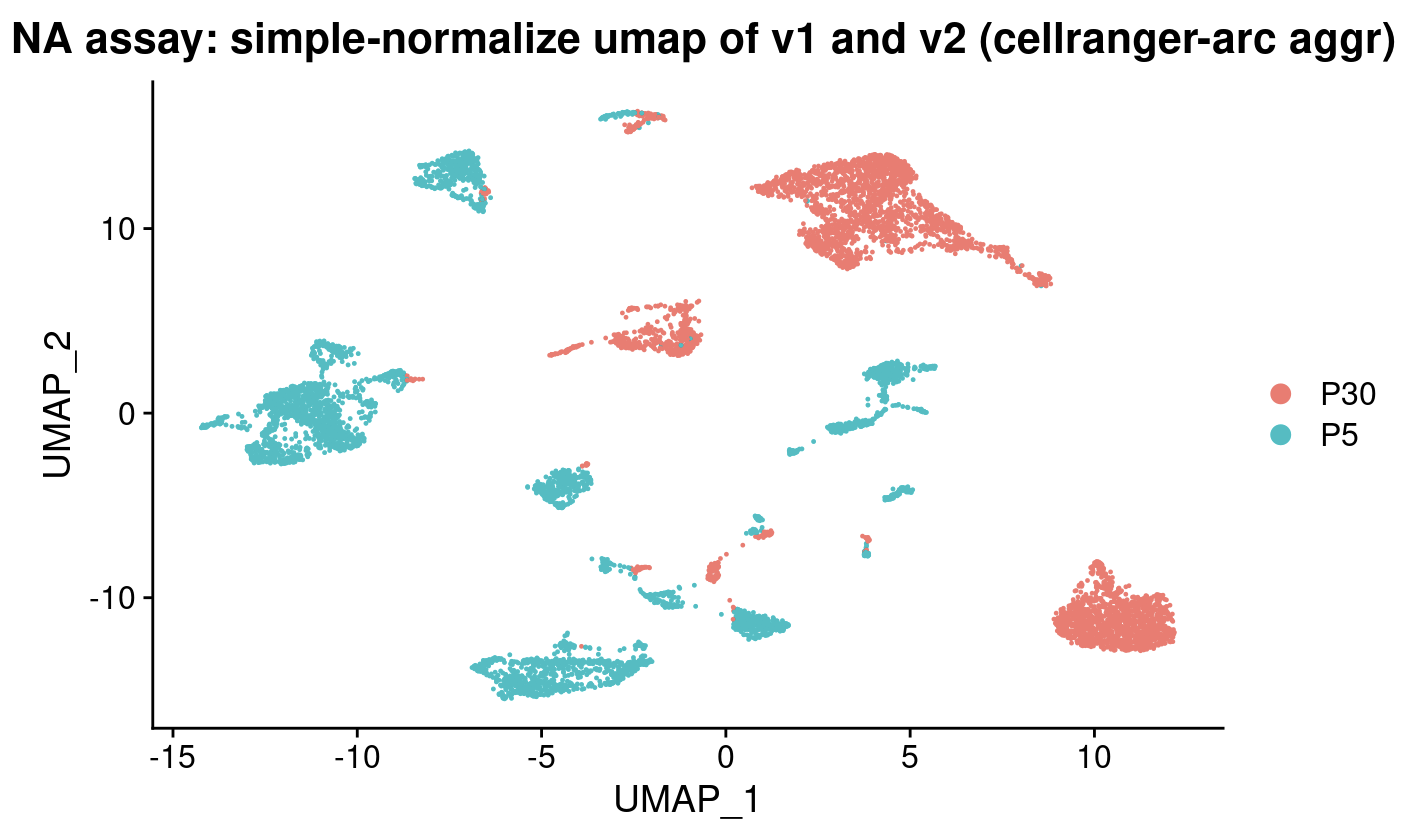
Observe batch effect in peaks assay?
DefaultAssay(mouse_lung_aggr_filter) <- "peaks"


# Observe batch effect in peaks assay
# q5: top 95% most common features
mouse_lung_aggr_filter <- FindTopFeatures(mouse_lung_aggr_filter, min.cutoff = "q5")
mouse_lung_aggr_filter <- RunTFIDF(mouse_lung_aggr_filter)
mouse_lung_aggr_filter <- RunSVD(mouse_lung_aggr_filter)
mouse_lung_aggr_filter <- RunUMAP(object = mouse_lung_aggr_filter,
                                  reduction = "lsi",
                                  reduction.name = "atac_umap",
                                  dims = 2:50)

DimPlot(mouse_lung_aggr_filter,
        reduction = "atac_umap",
        label = TRUE,
        label.size = 2.5,
        repel = TRUE,
        group.by = "sample") +
  ggtitle("peaks assay: normalize umap (all sample at once)\\n of v1 and v2 (cellranger-arc aggr)")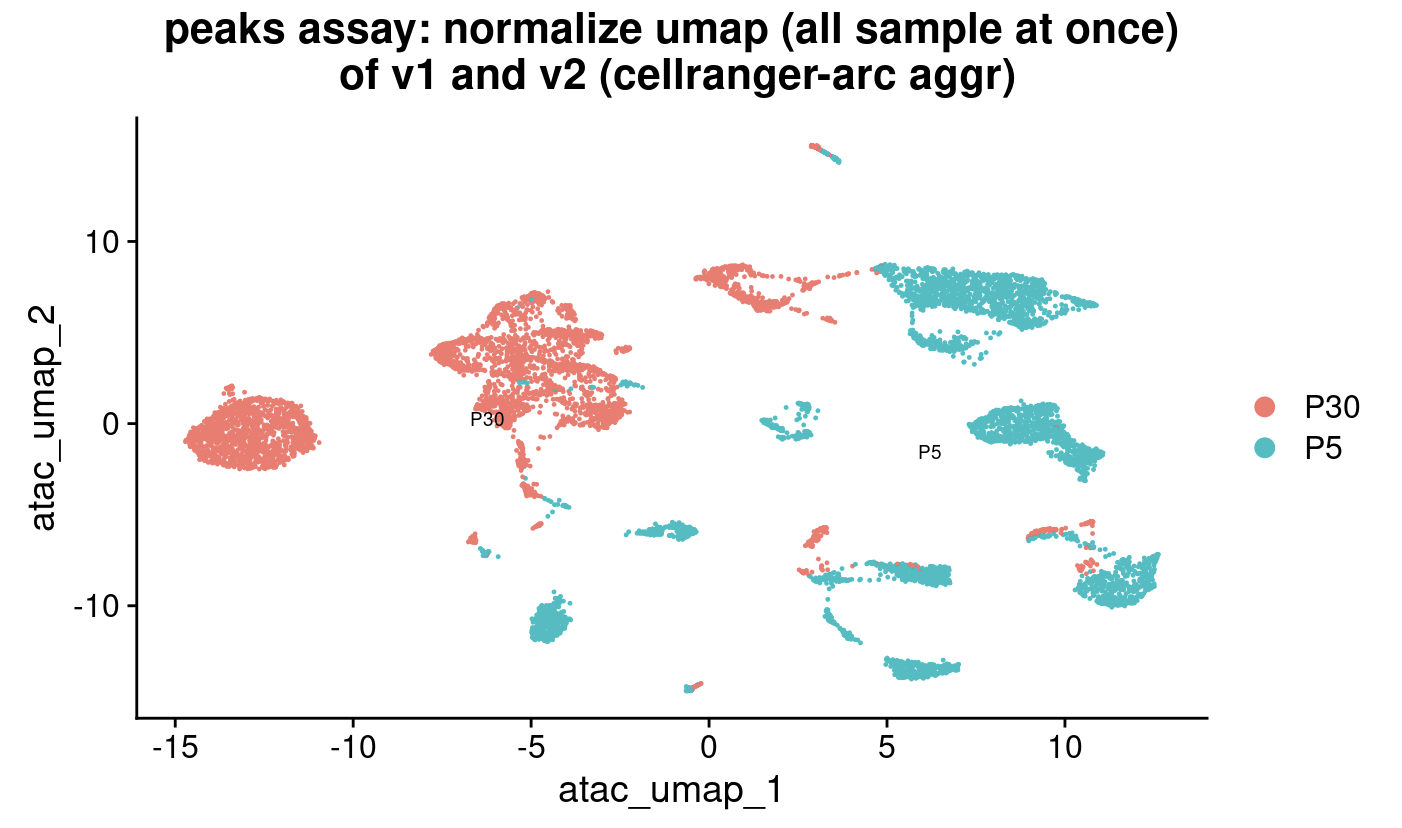
Regress out Cell cycle effects
get canonical markers for mouse cell cycle
# Download cell cycle genes for organism at <https://github.com/hbc/tinyatlas/tree/master/cell_cycle>. Read it in with:

cc_file <- getURL("<https://raw.githubusercontent.com/hbc/tinyatlas/master/cell_cycle/Mus_musculus.csv>")
cell_cycle_genes <- read.csv(text = cc_file)


# Connect to AnnotationHub
ah <- AnnotationHub()

# Access the Ensembl database for organism
ahDb <- query(ah,
              pattern = c("Mus musculus", "EnsDb"),
              ignore.case = TRUE)

# Acquire the latest annotation files
id <- ahDb %>%
        mcols() %>%
        rownames() %>%
        tail(n = 1)

# Download the appropriate Ensembldb database
edb <- ah[[id]]

# Extract gene-level information from database
annotations_markerG <- genes(edb,
                     return.type = "data.frame")

# Select annotations of interest
annotations_markerG <- annotations_markerG %>%
        dplyr::select(gene_id, gene_name, seq_name, gene_biotype, description)


# Get gene names for Ensembl IDs for each gene
cell_cycle_markers <- dplyr::left_join(cell_cycle_genes, annotations_markerG, by = c("geneID" = "gene_id"))

# Acquire the S phase genes
s_genes <- cell_cycle_markers %>%
        dplyr::filter(phase == "S") %>%
        pull("gene_name")

# Acquire the G2M phase genes
g2m_genes <- cell_cycle_markers %>%
        dplyr::filter(phase == "G2/M") %>%
        pull("gene_name")
Perform cell cycle scoring
DefaultAssay(mouse_lung_aggr_filter) <- "RNA"


# Perform cell cycle scoring
seurat_phase_V1andV2 <- CellCycleScoring(mouse_lung_aggr_filter,
                                 g2m.features = g2m_genes,
                                 s.features = s_genes)

# Perform PCA and color by cell cycle phase
# but first, 確定 Variable features have 有被 set:

#seurat_phase <- FindVariableFeatures(seurat_phase,
#                     selection.method = "vst",
#                     nfeatures = 8000,
#                     verbose = FALSE)


# 測試 regress 前後的差異

# if not regress out cell cycle effect
seurat_phase_V1andV2_NonRegress <- ScaleData(seurat_phase_V1andV2,
                                     features = rownames(seurat_phase_V1andV2))

seurat_phase_V1andV2_NonRegress <- RunPCA(seurat_phase_V1andV2_NonRegress,
                                          features = c(s_genes, g2m_genes))


# if Regress out cell cycle effect
seurat_phase_V1andV2_Regress <- ScaleData(seurat_phase_V1andV2,
                          vars.to.regress = c("S.Score", "G2M.Score"),
                          features = rownames(seurat_phase_V1andV2))
seurat_phase_V1andV2_Regress <- RunPCA(seurat_phase_V1andV2_Regress,
                               features = c(s_genes, g2m_genes))


DimPlot(seurat_phase_V1andV2_NonRegress,
        reduction = "pca",
        group.by= "Phase") +
  ggtitle("v1 and v2: not regress out cell cycle effects")

DimPlot(seurat_phase_V1andV2_Regress,
        reduction = "pca",
        group.by= "Phase") +
  ggtitle("v1 and v2: regress out cell cycle effects")
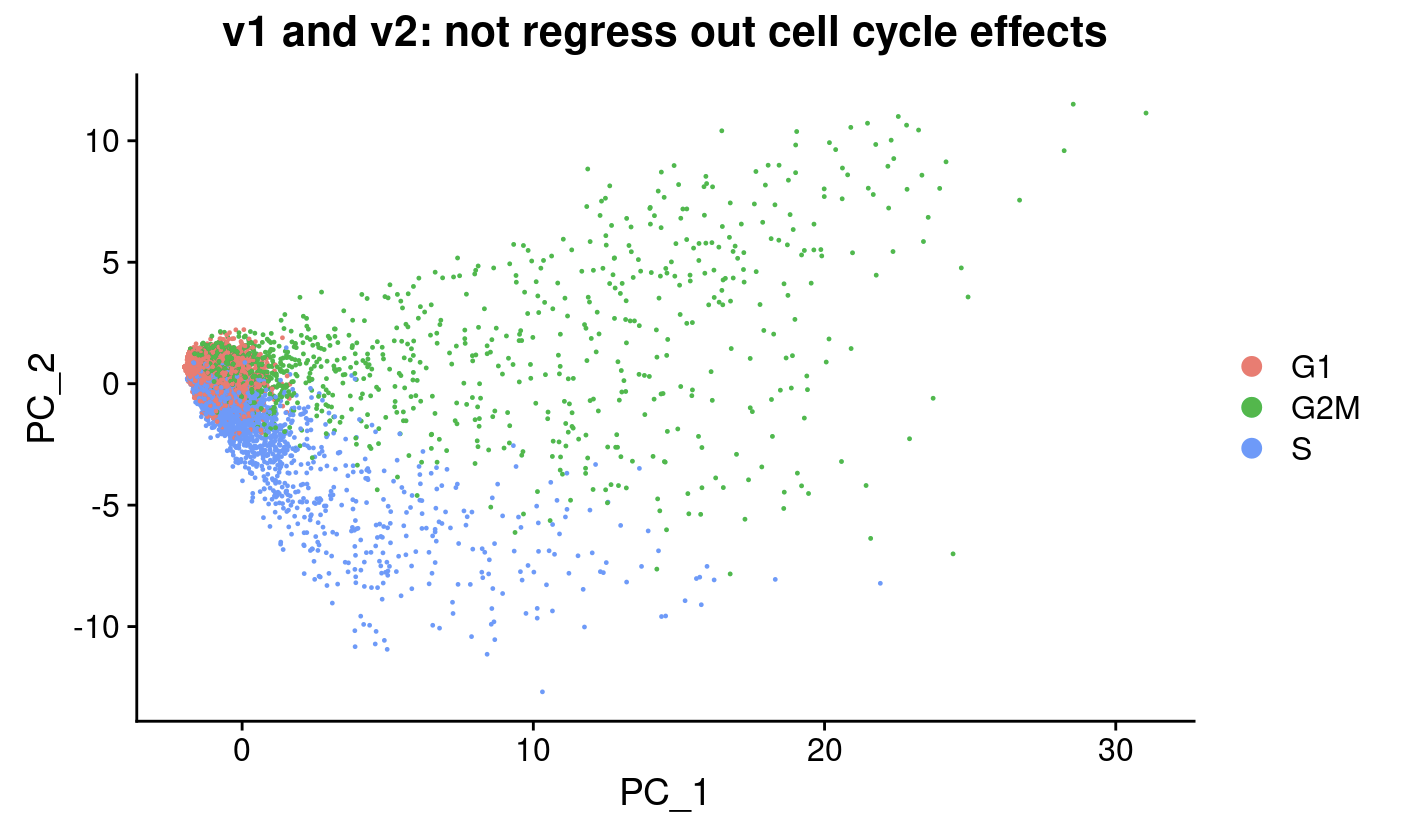
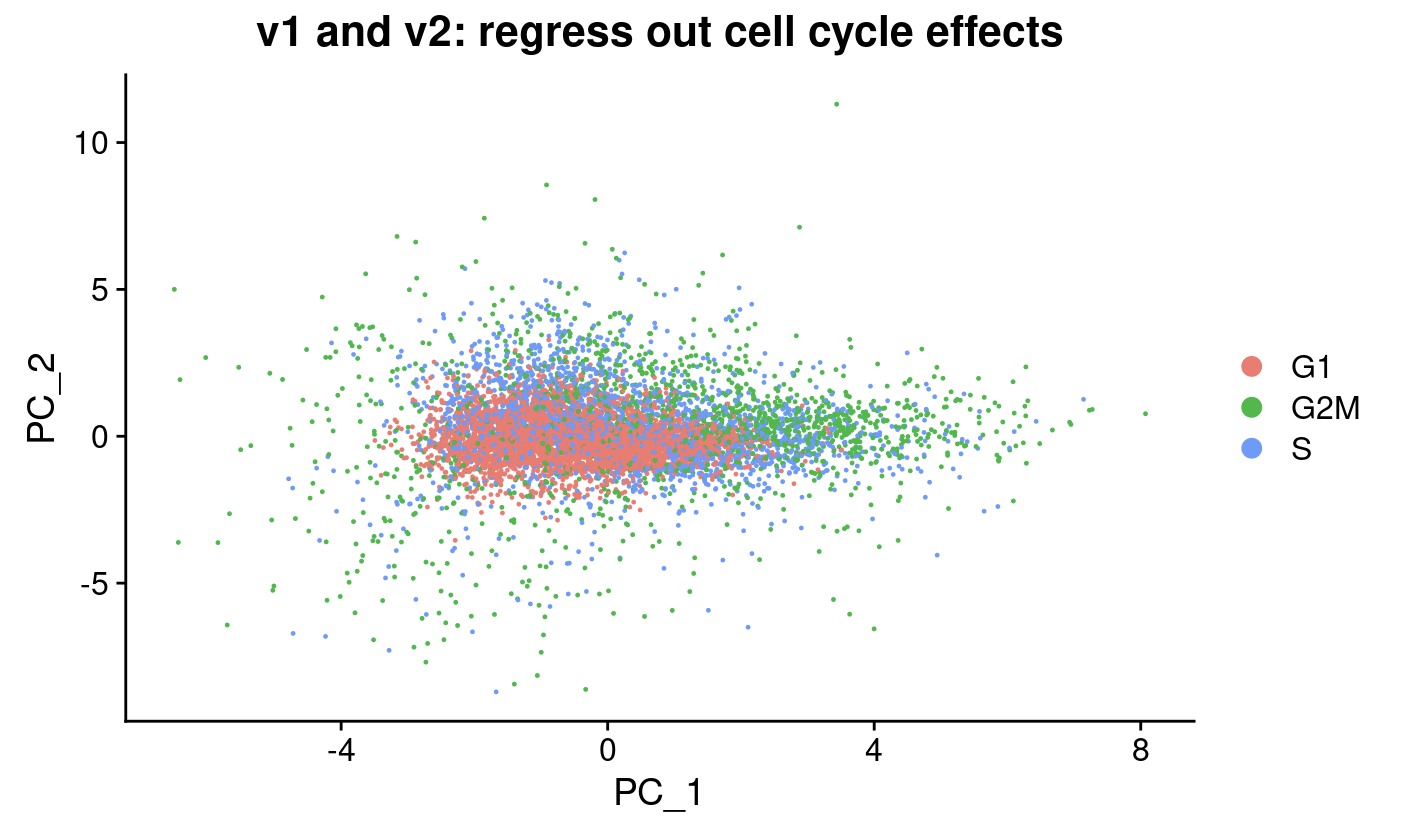
v1 workflow (IntegrateData)
Split and SCTransform (regress out unwanted variation)
# 把剛剛 seurat_phase計算的 s_genes與 g2m_genes資料加入到__中
mouse_lung_v1 <- mouse_lung_aggr_filter
mouse_lung_v1@meta.data <- seurat_phase_V1andV2_Regress@meta.data


DefaultAssay(mouse_lung_v1) <- "RNA"

# split object
split_seurat <- SplitObject(mouse_lung_v1, split.by = "sample")

# SCTransform n=16000 var features for each object
rna.list <- lapply(X = split_seurat, function(x){
   CreateSeuratObject(x@assays$RNA@counts, meta.data = x@meta.data) %>%
   SCTransform(vst.flavor="v2",
               vars.to.regress = c("S.Score", "G2M.Score", "percent.mt"),
               verbose = TRUE,
               ncells = 5000,
               variable.features.n = 16000)
})

# Select the most variable features to use for integration
integ_features <- SelectIntegrationFeatures(object.list = rna.list,
                                            nfeatures = length(rna.list$P5@assays$SCT@var.features))

# Prepare the SCT list object for integration
rna.list <- PrepSCTIntegration(object.list = rna.list,
                                   anchor.features = integ_features)


# perform CCA integration
# find the best buddies or anchors and filter incorrect anchors.
anchors.sct.norm <- FindIntegrationAnchors(object.list = rna.list,
                                           normalization.method = "SCT",
                                           anchor.features = integ_features,
                                           n.trees = 100)

combined.sct_v1 <- IntegrateData(anchorset = anchors.sct.norm,
                              normalization.method = "SCT")

# now the defaultAssay is "integrated"
# if not scaled yet, do:
# combined.sct <- ScaleData(combined.sct)

combined.sct_v1 <- RunPCA(object = combined.sct_v1,
                       reduction.name = "integrated_pca")
combined.sct_v1 <- RunUMAP(combined.sct_v1,
                        dims = 1:50,
                        reduction = "integrated_pca",
                        reduction.name = "integrated_umap")

# Given a merged object with multiple SCT models, this function uses minimum of the median UMI (calculated using the raw UMI counts) of individual objects to reverse the individual SCT regression model using minimum of median UMI as the sequencing depth covariate. The counts slot of the SCT assay is replaced with recorrected counts and the data slot is replaced with log1p of recorrected counts.
combined.sct.consistent_v1 <- PrepSCTFindMarkers(combined.sct_v1,
                                                 assay = 'SCT')

DimPlot(combined.sct.consistent_v1,
        label = TRUE,
        reduction = 'integrated_umap',
        label.size = 2.5,
        repel = TRUE,
        group.by = "sample") +
  ggtitle("v1: RNA integrated umap")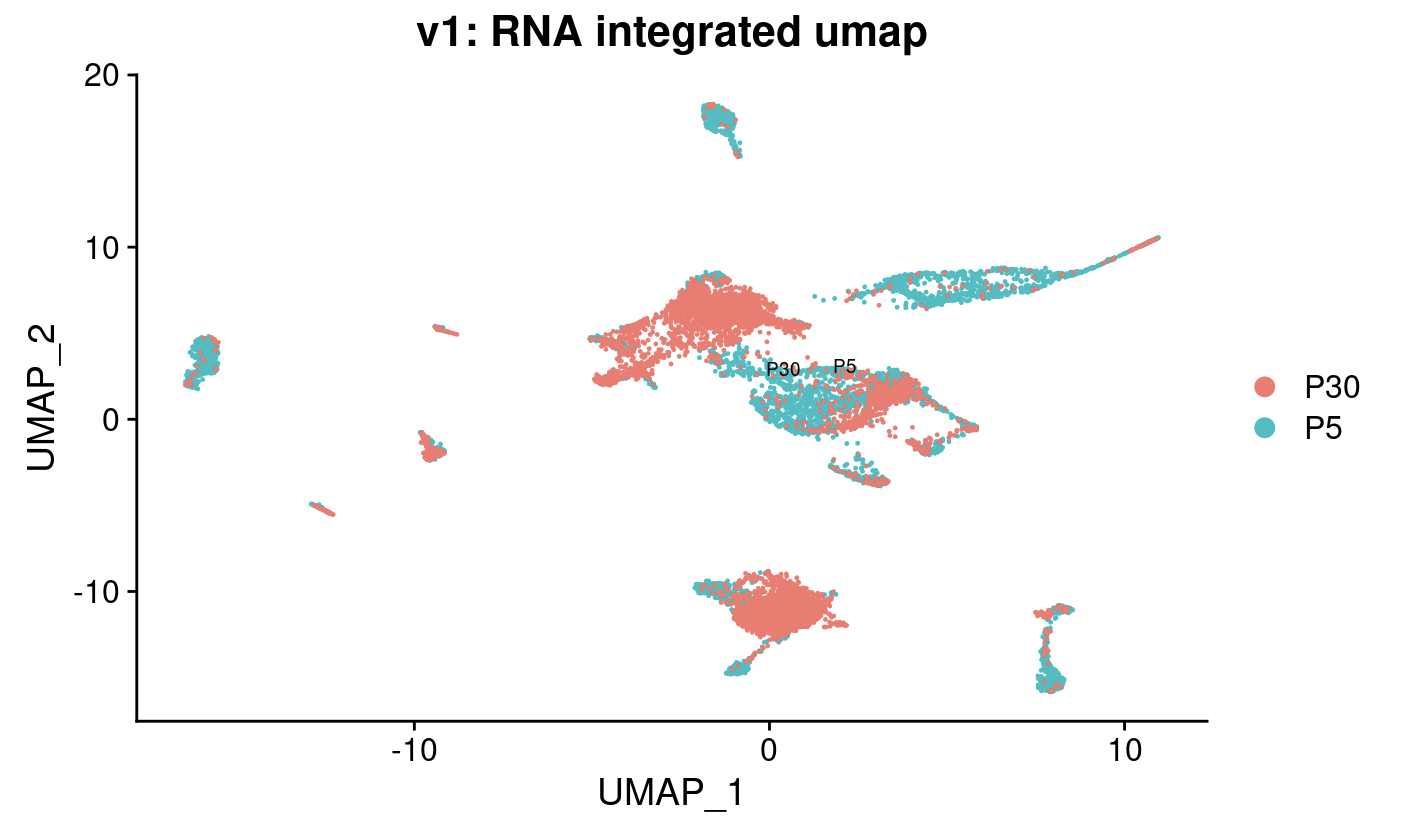
Split and normalization (peaks assay)
DefaultAssay(mouse_lung_aggr_filter) <- "peaks"
DefaultAssay(mouse_lung_v1) <- "peaks"

# split
obj.list <- SplitObject(mouse_lung_v1, split.by = "sample")

# normalization of each
# make sure to keep peak counts > 0
atac.list <- lapply(X = obj.list, function(x){
    peak_keep = which(rowSums(x@assays$peaks@counts) > 0)
    CreateSeuratObject(x@assays$peaks@counts[peak_keep,],
                       meta.data = x@meta.data,
                       assay = 'peaks')   %>%
        FindTopFeatures(min.cutoff = "q5") %>%
        RunTFIDF() %>%
        RunSVD()
})


# integration
# find integration anchors
integration.anchors <- FindIntegrationAnchors(
  object.list = atac.list,
  reduction = "rlsi",
  anchor.features = rownames(atac.list$P5),
  dims = 2:50,
  n.trees = 30)

# integrate LSI embeddings
atac.integrated_v1 <- IntegrateEmbeddings(
                        anchorset = integration.anchors,
                        reductions = mouse_lung_aggr_filter[["lsi"]],
                        new.reduction.name = "integrated_lsi",
                        dims.to.integrate = 1:50)


atac.integrated_v1 <- RunUMAP(atac.integrated_v1,
                           reduction = 'integrated_lsi',
                           dims = 2:50,
                           reduction.name = "atac_integrated_umap")


DimPlot(atac.integrated_v1,
        reduction = "atac_integrated_umap",
        label = TRUE,
        label.size = 2.5,
        repel = TRUE,
        group.by = "sample") +
  ggtitle("v1: peaks integrated umap")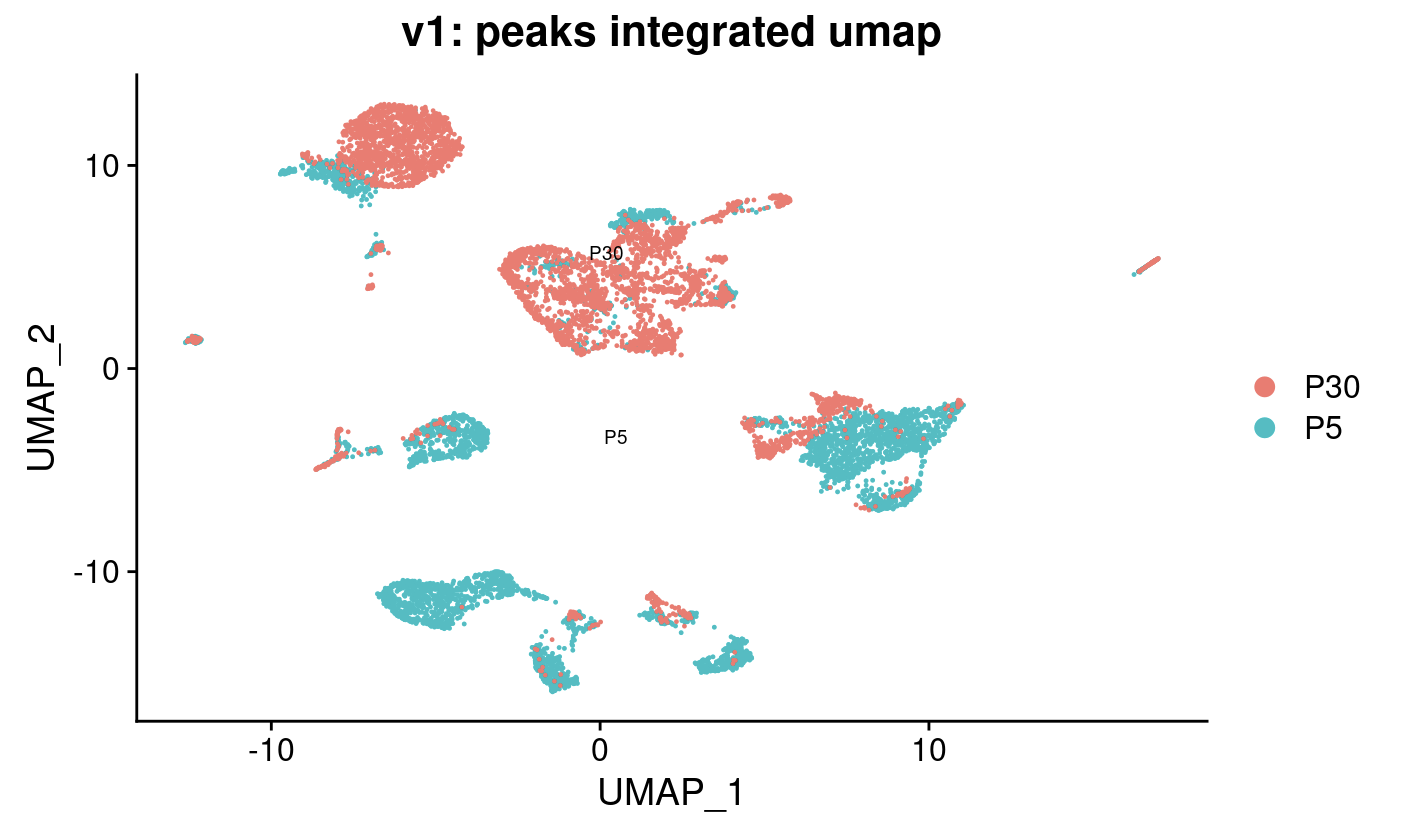
Combine all assays
integrated_multiome_v1 <- combined.sct.consistent_v1

integrated_multiome_v1[["peaks"]]  <- CreateChromatinAssay(
                        counts = atac.integrated_v1@assays$peaks@counts,
                        sep = c(":", "-"),
                        genome = 'mm10',
                        fragments = frag.file_filter_V1andV2,
                        annotation = annotations)


integrated_multiome_v1[["spliced"]] <- CreateAssayObject(counts = GetAssayData(
                                                                    object =  mouse_lung_v1,
                                                                    assay = "spliced",
                                                                    slot = 'data'))
integrated_multiome_v1[["unspliced"]] <- CreateAssayObject(counts = GetAssayData(
                                                                    object =  mouse_lung_v1,
                                                                    assay = "unspliced",
                                                                    slot = 'data'))
integrated_multiome_v1[["ambiguous"]] <- CreateAssayObject(counts = GetAssayData(
                                                                    object =  mouse_lung_v1,
                                                                    assay = "ambiguous",
                                                                    slot = 'data'))


integrated_multiome_v1@reductions <- append(combined.sct.consistent_v1@reductions,
                                          atac.integrated_v1@reductions)
WNN
integrated_multiome_v1 <- FindMultiModalNeighbors(integrated_multiome_v1,
                                               reduction.list = list("integrated_pca",
                                                                     "integrated_lsi"),
                                               dims.list = list(1:50, 2:50),
                                               k.nn = 100)

integrated_multiome_v1 <- RunUMAP(integrated_multiome_v1,
                                nn.name = "weighted.nn",
                                reduction.name = "wnn_umap",
                                return.model=TRUE)
# res = 1
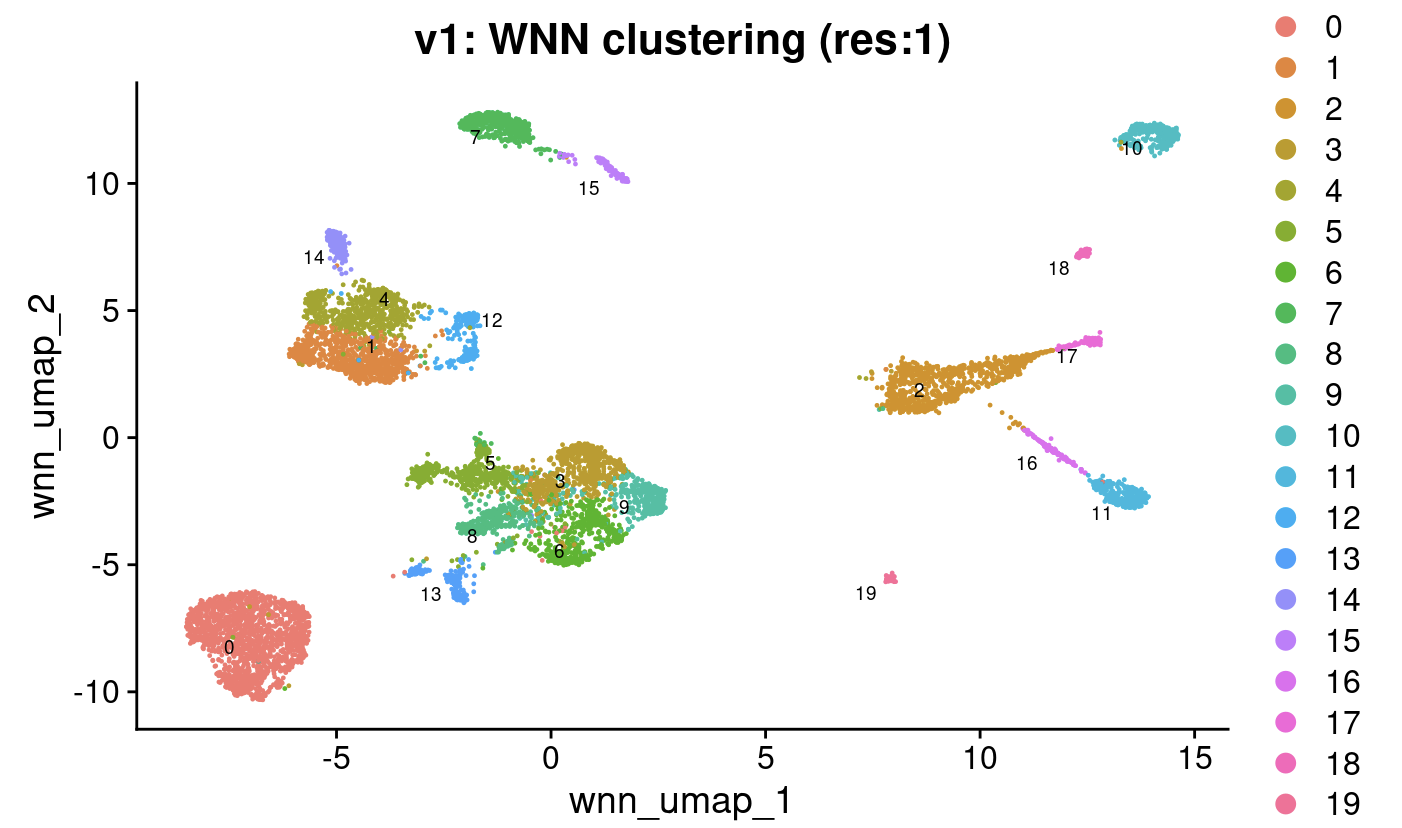
integrated_multiome_v1 <- FindClusters(integrated_multiome_v1,
                                    graph.name = "wsnn",
                                    algorithm = 3,
                                    verbose = FALSE,
                                    resolution = 1)

# WNN clustering
DimPlot(integrated_multiome_v1,
        reduction = "wnn_umap",
        label = TRUE,
        label.size = 2.5,
        repel = TRUE,
        group.by = "sample") +
ggtitle("v1: WNN clustering")

DimPlot(integrated_multiome_v1,
        reduction = "wnn_umap",
        label = TRUE,
        label.size = 2.5,
        repel = TRUE,
        group.by = "wsnn_res.1") +
  ggtitle("v1: WNN clustering (res:1)")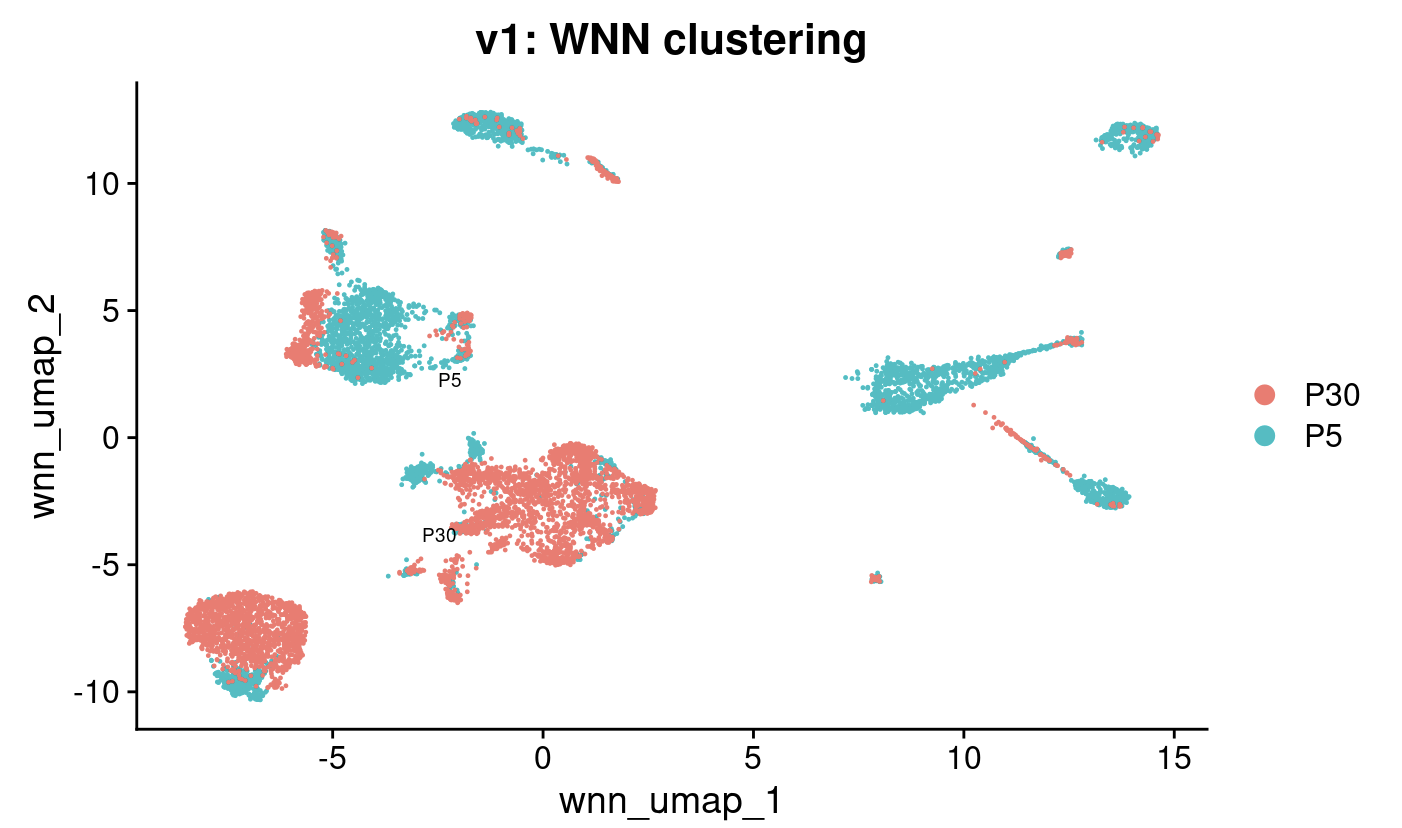
v2 workflow (without IntegrateData)
SCTransform without IntegrateData
SCTransform samples separately
https://github.com/satijalab/sctransform/issues/55#issuecomment-633843730
# 把剛剛 seurat_phase計算的 s_genes與 g2m_genes資料加入到__中
mouse_lung_v2 <- mouse_lung_aggr_filter
mouse_lung_v2@meta.data <- seurat_phase_V1andV2_Regress@meta.data
DefaultAssay(mouse_lung_v2) <- "RNA"


# split object
split_seurat <- SplitObject(mouse_lung_v2, split.by = "sample")

# SCTransform n=16000 var features for each object
rna.list <- lapply(X = split_seurat, function(x){
   CreateSeuratObject(x@assays$RNA@counts, meta.data = x@meta.data) %>%
   SCTransform(vst.flavor="v2",
               vars.to.regress = c("S.Score", "G2M.Score", "percent.mt"),
               verbose = TRUE,
               ncells = 5000,
               variable.features.n = 16000)
})


my_select_features_v2 <- SelectIntegrationFeatures(rna.list,
                                                nfeatures = 16000,
                                                assay = c("SCT","SCT"),
                                                verbose = TRUE)

combined.sct.consistent_v2 <- PrepSCTFindMarkers(merge(rna.list$P5,
                                                       rna.list$P30),
                                                 assay = 'SCT')


DefaultAssay(combined.sct.consistent_v2) <- "SCT"
VariableFeatures(combined.sct.consistent_v2) <- my_select_features_v2

combined.sct.consistent_v2 <- RunPCA(object = combined.sct.consistent_v2,
                                reduction.name = "SCT_pca")

combined.sct.consistent_v2 <- RunUMAP(combined.sct.consistent_v2,
                                 dims = 1:25,
                                 reduction = "SCT_pca",
                                 reduction.name = "SCT_umap")

DimPlot(combined.sct.consistent_v2,
        label = TRUE,
        reduction = 'SCT_umap',
        label.size = 2.5,
        repel = TRUE,
        group.by = "sample") +
  ggtitle("v2: RNA non-integrated umap")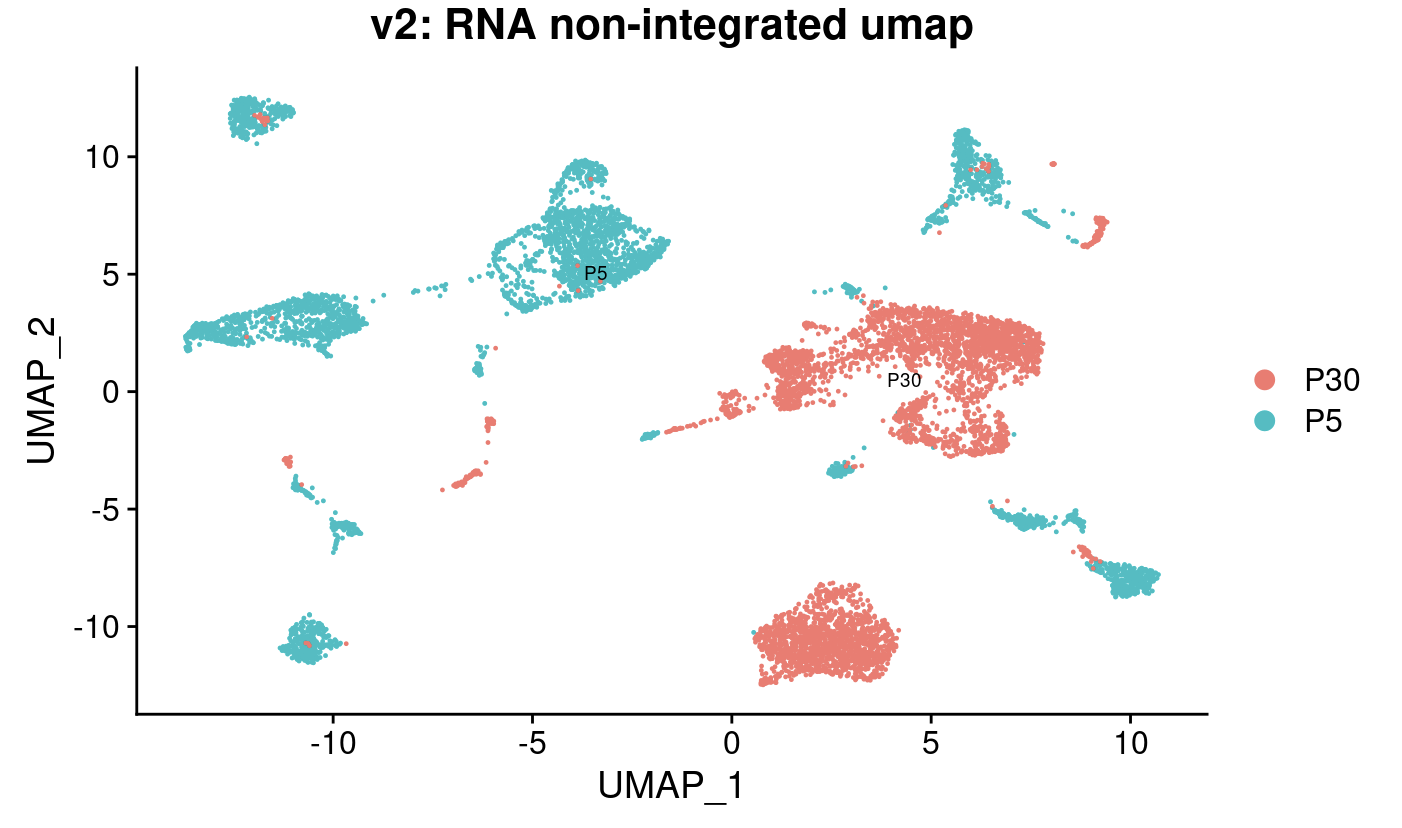
peaks
# split
obj.list <- SplitObject(mouse_lung_v2, split.by = "sample")

# normalization of each
# make sure to keep peak counts > 0
atac.list <- lapply(X = obj.list, function(x){

    peak_keep = which(rowSums(x@assays$peaks@counts) > 0)
    CreateSeuratObject(x@assays$peaks@counts[peak_keep,],
                       meta.data = x@meta.data,
                       assay = 'peaks')   %>%
        FindTopFeatures(min.cutoff = "q5") %>%
        RunTFIDF()
})

atac.integrated_v2 <- merge(atac.list$P5, atac.list$P30)
atac.integrated_v2 <- FindTopFeatures(atac.integrated_v2, min.cutoff = "q5")
atac.integrated_v2 <- RunSVD(atac.integrated_v2)
atac.integrated_v2 <- RunUMAP(atac.integrated_v2,
                           reduction = 'lsi',
                           dims = 2:50,
                           reduction.name = "peaks_umap")


DimPlot(atac.integrated_v2,
        reduction = "peaks_umap",
        label = TRUE,
        label.size = 2.5,
        repel = TRUE,
        group.by = "sample") +
  ggtitle("v2: peaks non-integrated umap")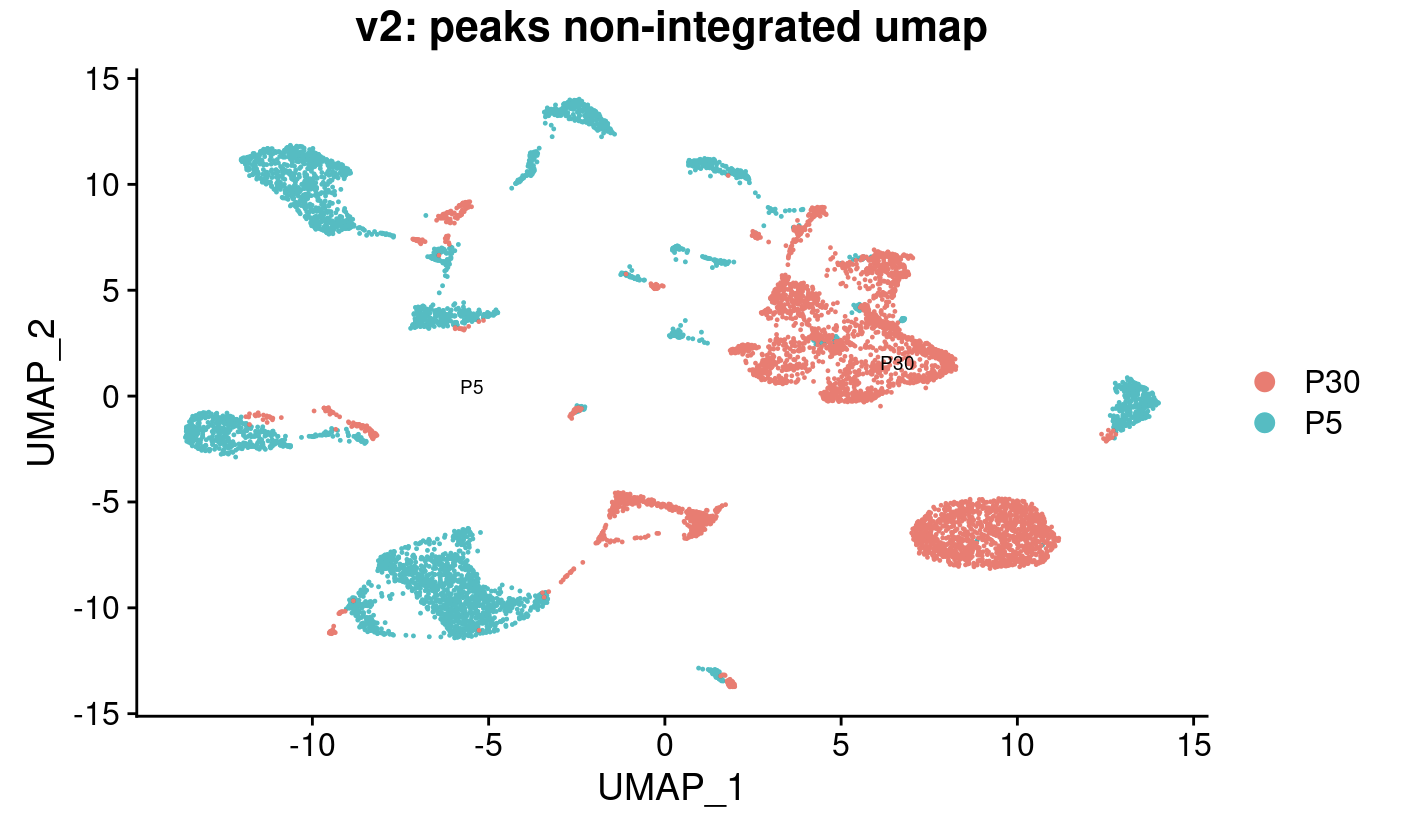
Combine all assays
integrated_multiome_v2 <- atac.integrated_v2


# move just the "data" slots!!!!!!
integrated_multiome_v2[["RNA"]]  <- CreateAssayObject(counts = GetAssayData(
                                                              object =  combined.sct.consistent_v2,
                                                              assay = "RNA",
                                                              slot =  "counts"))
integrated_multiome_v2[["SCT"]]  <- CreateAssayObject(counts = GetAssayData(
                                                              object =  combined.sct.consistent_v2,
                                                              assay = "SCT",
                                                              slot =  "data"))

# 所以這邊最後integrated_multiome裏面
# SCT assay 的 "counts" slot 其實顯示的數值就跟其 "data" slot 一樣

# 要再把 mouse_lung_filter_SCT 的 SCT assay counts slot 複製過來
integrated_multiome_v2@assays$SCT@counts <- combined.sct.consistent_v2@assays$SCT@counts

integrated_multiome_v2@reductions <- append(integrated_multiome_v2@reductions,
                                            combined.sct.consistent_v2@reductions)
WNN analysis
integrated_multiome_v2 <- FindMultiModalNeighbors(integrated_multiome_v2,
                                               reduction.list = list("SCT_pca",
                                                                     "lsi"),
                                               dims.list = list(1:50, 2:50),
                                               k.nn = 100)

integrated_multiome_v2 <- RunUMAP(integrated_multiome_v2,
                                nn.name = "weighted.nn",
                                reduction.name = "wnn_umap",
                                return.model=TRUE)
# res = 1
integrated_multiome_v2 <- FindClusters(integrated_multiome_v2,
                                    graph.name = "wsnn",
                                    algorithm = 3,
                                    verbose = FALSE,
                                    resolution = 1)


# WNN clustering
DimPlot(integrated_multiome_v2,
        reduction = "wnn_umap",
        label = TRUE,
        label.size = 2.5,
        repel = TRUE,
        group.by = "sample") +
ggtitle("v2: WNN clustering")

DimPlot(integrated_multiome_v2,
        reduction = "wnn_umap",
        label = TRUE,
        label.size = 2.5,
        repel = TRUE,
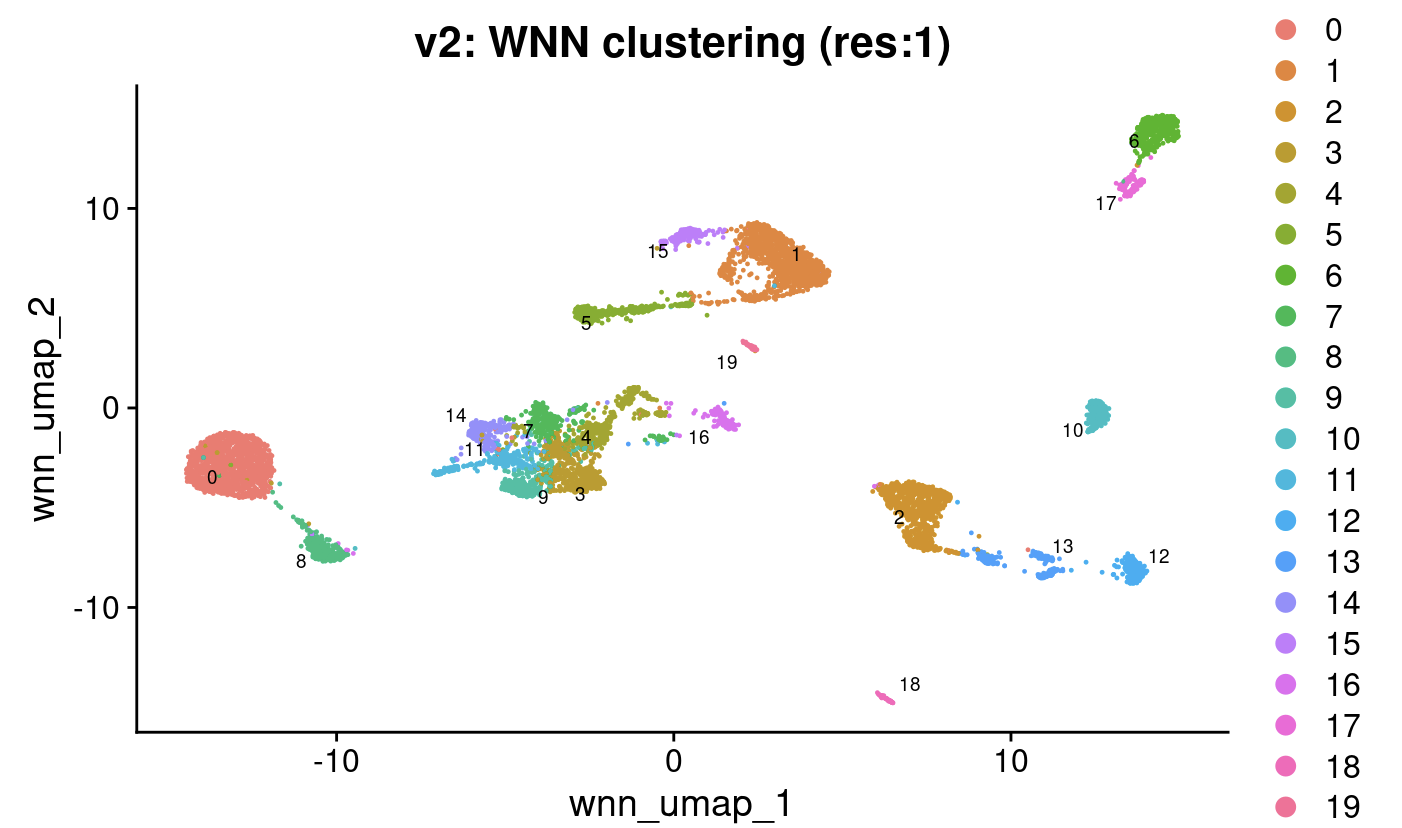
        group.by = "wsnn_res.1") +
  ggtitle("v2: WNN clustering (res:1)")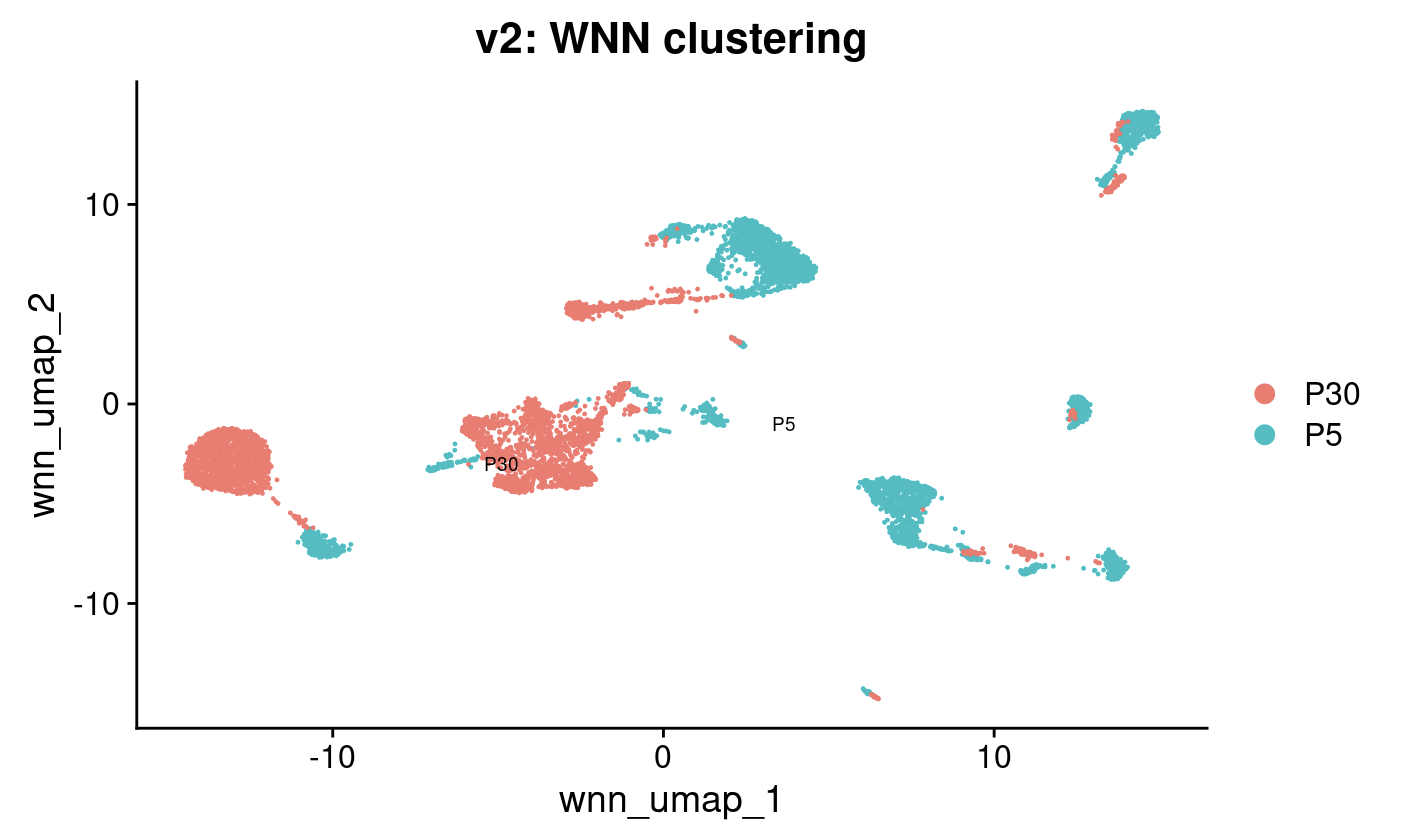
v3 and v4 raw data process
Import RNA assay from cellranger-arc count results
mouse_lung_count_P5 <-
  runSoupX(
    Read10X_h5("###")$`Gene Expression`,
    Read10X_h5("###")$`Gene Expression`,
            "###")


mouse_lung_count_P30 <-
  runSoupX(
    Read10X_h5("###")$`Gene Expression`,
    Read10X_h5("###")$`Gene Expression`,
            "###")


mouse_lung_count_P5 <- CreateSeuratObject(counts = mouse_lung_count_P5)
mouse_lung_count_P30 <- CreateSeuratObject(counts = mouse_lung_count_P30)

# 確認去除 Gm42418 gene
# rownames(mouse_lung_P5@assays$RNA)[grep("^Gm42418", rownames(mouse_lung_P5@assays$RNA), perl = TRUE)] # rownames(mouse_lung_P30@assays$RNA)[grep("^Gm42418", rownames(mouse_lung_P30@assays$RNA), perl = TRUE)]


# 由於 P5 P30 的細胞 ID 會完全一樣,所以要更改 P30 的 cell ID 成 "xxxxxx-2"
mouse_lung_count_P30 <- RenameCells(mouse_lung_count_P30,
                             new.names = gsub(pattern = "-1$",
                                              replacement = "-2",
                                              colnames(mouse_lung_count_P30))
)


mouse_lung_count <- merge(mouse_lung_count_P5,
                    mouse_lung_count_P30)
gene-level filtering
DefaultAssay(mouse_lung_count) <- "RNA"

counts <- GetAssayData(object = mouse_lung_count, slot = "counts")
nonzero <- counts > 0

keep_genes <- Matrix::rowSums(nonzero) >= 10
filtered_counts <- counts[keep_genes, ]

mouse_lung_count <- CreateSeuratObject(filtered_counts,
                                       meta.data = mouse_lung_count@meta.data)
Process the cell ID in loom file (have to do it again?)
# 把 "P5_scRNA:" 去除
P5_loom_V3andV4 <- RenameCells(P5_loom_raw,
                             new.names = gsub(pattern = "^P5_scRNA:",
                                              replacement = "",
                                              colnames(P5_loom_raw))
)

# 把 "x" 改成 "-1"
P5_loom_V3andV4 <- RenameCells(P5_loom_V3andV4,
                             new.names = gsub(pattern = "x$",
                                              replacement = "-1",
                                              colnames(P5_loom_V3andV4))
)


#### P30
# 把 "P30_scRNA:" 去除
P30_loom_V3andV4 <- RenameCells(P30_loom_raw,
                             new.names = gsub(pattern = "^P30_scRNA:",
                                              replacement = "",
                                              colnames(P30_loom_raw))
)

# 把 "x" 改成 "-2"
P30_loom_V3andV4 <- RenameCells(P30_loom_V3andV4,
                             new.names = gsub(pattern = "x$",
                                              replacement = "-2",
                                              colnames(P30_loom_V3andV4))
)

loom_V3andV4 <- merge(P5_loom_V3andV4,
                      P30_loom_V3andV4)
Find consensus cell ID between loom and Seurat object (have to do it again?)
# remove Gm42418 feature in loom file so the feature numbers is same as seurat RNA assays
counts <- GetAssayData(loom_V3andV4, assay = "spliced")
counts <- counts[-(which(rownames(counts) %in% c('Gm42418'))),]
loom_V3andV4 <- subset(loom_V3andV4, features = rownames(counts))


# Pull cell names
CellID_seu <- colnames(mouse_lung_count)
CellID_loom <- colnames(loom_V3andV4)

# Identify shared cells between both objects
shared_cellIDs_V3andV4 <- intersect(x = CellID_seu,
                            y = CellID_loom)

# filter both loom and seurat object
mouse_lung_count$cells <- colnames(mouse_lung_count)
mouse_lung_count <- subset(mouse_lung_count,
               subset = cells %in% shared_cellIDs_V3andV4)

loom_V3andV4$cells <- colnames(loom_V3andV4)
loom_V3andV4 <- subset(loom_V3andV4,
               subset = cells %in% shared_cellIDs_V3andV4)
Import ATAC assay and callpeaks
# the 10x hdf5 file contains both data types
# extract ATAC data
atac_counts_P5 <- Read10X_h5("###")$Peaks
atac_counts_P30 <- Read10X_h5("###")$Peaks


# P5
# Now add in the ATAC-seq data
grange.counts <- StringToGRanges(rownames(atac_counts_P5), sep = c(":", "-"))
# we'll only use peaks in standard chromosomes
grange.use <- seqnames(grange.counts) %in% standardChromosomes(grange.counts)
atac_counts_P5 <- atac_counts_P5[as.vector(grange.use), ]


annotations <- GetGRangesFromEnsDb(ensdb = EnsDb.Mmusculus.v79)
seqlevelsStyle(annotations) <- 'UCSC'
genome(annotations) <- "mm10"


# add Chromatin Assay in seurat object
atac_assay_P5  <- CreateChromatinAssay(
   counts = atac_counts_P5,
   sep = c(":", "-"),
   genome = 'mm10',
   fragments = "###",
   min.cells = 10,
   annotation = annotations
 )

atac_P5 <- CreateSeuratObject(counts = atac_assay_P5, assay = "ATAC")

# filter
atac_P5$cells <- colnames(atac_P5)
atac_filter_P5 <- subset(atac_P5,
                         subset = cells %in% shared_cellIDs_V3andV4)


# P30
# Now add in the ATAC-seq data
grange.counts <- StringToGRanges(rownames(atac_counts_P30), sep = c(":", "-"))
# we'll only use peaks in standard chromosomes
grange.use <- seqnames(grange.counts) %in% standardChromosomes(grange.counts)
atac_counts_P30 <- atac_counts_P30[as.vector(grange.use), ]


# add Chromatin Assay in seurat object
atac_assay_P30  <- CreateChromatinAssay(
   counts = atac_counts_P30,
   sep = c(":", "-"),
   genome = 'mm10',
   fragments = "###",
   min.cells = 10,
   annotation = annotations
 )

atac_P30 <- CreateSeuratObject(counts = atac_assay_P30,
                               assay = "ATAC")


# rename the atac_P30
atac_P30 <- RenameCells(atac_P30,
                             new.names = gsub(pattern = "-1$",
                                              replacement = "-2",
                                              colnames(atac_P30)))


# filter
atac_P30$cells <- colnames(atac_P30)
atac_filter_P30 <- subset(atac_P30,
                          subset = cells %in% shared_cellIDs_V3andV4)


#################################
atac_V3andV4 <- merge(atac_filter_P5,
                      atac_filter_P30)
Callpeaks
DefaultAssay(atac_V3andV4) <- "ATAC"
atac_V3andV4@meta.data$sample <- NA
atac_V3andV4$cells <- colnames(atac_V3andV4)
atac_V3andV4@meta.data$sample[which(str_detect(atac_V3andV4@meta.data$cells, "-1$"))] <- "P5"
atac_V3andV4@meta.data$sample[which(str_detect(atac_V3andV4@meta.data$cells, "-2$"))] <- "P30"


# call peaks using MACS2
peaks_V3andV4 <- CallPeaks(atac_V3andV4,
									macs2.path = "/data/core/jordan/CondaEnv/macs2/bin/macs2",
									group.by = "sample",
									combine.peaks = TRUE)

# remove peaks on nonstandard chromosomes and in genomic blacklist regions
peaks_V3andV4 <- keepStandardChromosomes(peaks_V3andV4, pruning.mode = "coarse")
peaks_V3andV4 <- subsetByOverlaps(x = peaks_V3andV4, ranges = blacklist_mm10, invert = TRUE)

# Filter out bad peaks based on length
peakwidths <- width(peaks_V3andV4)
peaks_V3andV4 <- peaks_V3andV4[peakwidths  < 10000 & peakwidths > 20]


# quantify counts in each peak
macs2_counts_V3andV4 <- FeatureMatrix(fragments = Fragments(atac_V3andV4),
														  features = peaks_V3andV4,
														  cells = colnames(atac_V3andV4))
Separate P5 and P30, then use their corresponding fragment files in CreateChromatinAssay
# P5
macs2_counts_V3andV4_P5 <- macs2_counts_V3andV4[,which(str_detect(colnames(macs2_counts_V3andV4), "-1$"))]

# 因為這邊是已經filter 的 Cell ID,所以需要 filter fragment file
Signac::FilterCells(fragments = "###",
            cells = colnames(macs2_counts_V3andV4_P5),
            outfile = "###")

frag.file_filter_V3andV4_P5 <- "###"


# create a new assay using the MACS2 peak set and add it to the Seurat object
peaks_assay_V3andV4_P5 <- CreateChromatinAssay(counts = macs2_counts_V3andV4_P5,
                                       fragments = frag.file_filter_V3andV4_P5,
						                           annotation = annotations)
peaks_V3andV4_P5 <- CreateSeuratObject(counts = peaks_assay_V3andV4_P5,
                               assay = "peaks")


##########################################################################################
##########################################################################################
# P30 要注意我前面有把 P30 從 "-1" 改成 "-2",但 fragment file 沒有這樣更改
# 所以還是要先改為 "-1"
macs2_counts_V3andV4_P30 <- macs2_counts_V3andV4[,which(str_detect(colnames(macs2_counts_V3andV4), "-2$"))]

colnames(macs2_counts_V3andV4_P30) <- gsub(pattern = "-2$",
                                              replacement = "-1",
                                              colnames(macs2_counts_V3andV4_P30))

# 因為這邊是已經filter 的 Cell ID,所以需要 filter fragment file
Signac::FilterCells(fragments = "###",
            cells = colnames(macs2_counts_V3andV4_P30),
            outfile = "###")


frag.file_filter_V3andV4_P30 <- "###"


# create a new assay using the MACS2 peak set and add it to the Seurat object
peaks_assay_V3andV4_P30 <- CreateChromatinAssay(counts = macs2_counts_V3andV4_P30,
                                        fragments = frag.file_filter_V3andV4_P30,
						                            annotation = annotations)

peaks_V3andV4_P30 <- CreateSeuratObject(counts = peaks_assay_V3andV4_P30,
                                assay = "peaks")


# 改回為 "-2"
peaks_V3andV4_P30 <- RenameCells(peaks_V3andV4_P30,
                             new.names = gsub(pattern = "-1$",
                                              replacement = "-2",
                                              colnames(peaks_V3andV4_P30)))


peaks_V3andV4 <- merge(peaks_V3andV4_P5,
                       peaks_V3andV4_P30)


# combine all seurat objects (non-normalied "counts" slot)
peaks_V3andV4[["RNA"]] <- CreateAssayObject(counts = GetAssayData(object =  mouse_lung_count,
                                                            assay = "RNA",
                                                            slot = 'counts'))
peaks_V3andV4[["spliced"]] <- CreateAssayObject(counts = GetAssayData(object =  loom_V3andV4,
                                                            assay = "spliced",
                                                            slot = 'counts'))
peaks_V3andV4[["unspliced"]] <- CreateAssayObject(counts = GetAssayData(object =  loom_V3andV4,
                                                            assay = "unspliced",
                                                            slot = 'counts'))
peaks_V3andV4[["ambiguous"]] <- CreateAssayObject(counts = GetAssayData(object =  loom_V3andV4,
                                                            assay = "ambiguous",
                                                            slot = 'counts'))
mouse_lung_count <- peaks_V3andV4
Calculate NS, TSS, novelty score and percentage of reads that map to the mitochondrial genome
DefaultAssay(mouse_lung_count) <- "peaks"

# Calculate the strength of the nucleosome signal per cell. Computes the ratio of fragments between 147 bp and 294 bp (mononucleosome) to fragments < 147 bp (nucleosome-free)
mouse_lung_count <- NucleosomeSignal(mouse_lung_count)
mouse_lung_count$nucleosome_group <- ifelse(mouse_lung_count$nucleosome_signal > 1, 'NS > 1', 'NS < 1')
FragmentHistogram(object = mouse_lung_count, group.by = 'nucleosome_group', region = 'chr1-1-10000000')


# Compute the transcription start site (TSS) enrichment score for each cell
mouse_lung_count <- TSSEnrichment(mouse_lung_count, fast = FALSE)
mouse_lung_count$high.tss <- ifelse(mouse_lung_count$TSS.enrichment > 2.5, 'High', 'Low')
TSSPlot(mouse_lung_count, group.by = 'high.tss', assay = 'peaks') + NoLegend()


####
# calculate novelty score 並且另外把metadata移出來
mouse_lung_count$log10GenesPerUMI <- log10(mouse_lung_count$nFeature_RNA) / log10(mouse_lung_count$nCount_RNA)

# The percentage of reads that map to the mitochondrial genome
mouse_lung_count[["percent.mt"]] <- PercentageFeatureSet(mouse_lung_count, assay = "RNA", pattern = "^mt-")
mouse_lung_count$percent.mt <- mouse_lung_count$percent.mt/100
Cell-level filtering
mouse_lung_count_filter <- subset(
  x = mouse_lung_count,
  subset =
    nCount_peaks < 70000 &
    nCount_peaks > 500 &

    nCount_RNA > 500 &
    nCount_RNA < 8000 &
		nFeature_RNA > 200 &
    nFeature_RNA < 4000 &

		log10GenesPerUMI > 0.9 &
    percent.mt < 0.4 &
    percent.mt > 0.005 &

    nucleosome_signal < 1 &
    TSS.enrichment > 2.5
)
# after filtering: 13472  ->  9472 cells
Observe batch effect in RNA assay?
DefaultAssay(mouse_lung_count_filter) <- "RNA"

mouse_lung_count_filter@meta.data$sample <- NA
mouse_lung_count_filter$cells <- colnames(mouse_lung_count_filter)
mouse_lung_count_filter@meta.data$sample[which(str_detect(mouse_lung_count_filter@meta.data$cells, "-1$"))] <- "P5"
mouse_lung_count_filter@meta.data$sample[which(str_detect(mouse_lung_count_filter@meta.data$cells, "-2$"))] <- "P30"


mouse_lung_count_filter <- NormalizeData(object =  mouse_lung_count_filter)
mouse_lung_count_filter <- FindVariableFeatures(object =  mouse_lung_count_filter, nfeatures = 16000)
mouse_lung_count_filter <- ScaleData(object =  mouse_lung_count_filter)
mouse_lung_count_filter <- RunPCA(object =  mouse_lung_count_filter)

#ElbowPlot(mouse_lung_count_filter) # 1:20 is enough

mouse_lung_count_filter <- RunUMAP(object =  mouse_lung_count_filter,
                             dims = 1:50,
                             umap.method = "uwot")
DimPlot(mouse_lung_count_filter,
        reduction = "umap",
        group.by = "sample") +
  ggtitle("RNA assay: simple-normalize umap of v3 and v4 (cellranger-arc count*2)")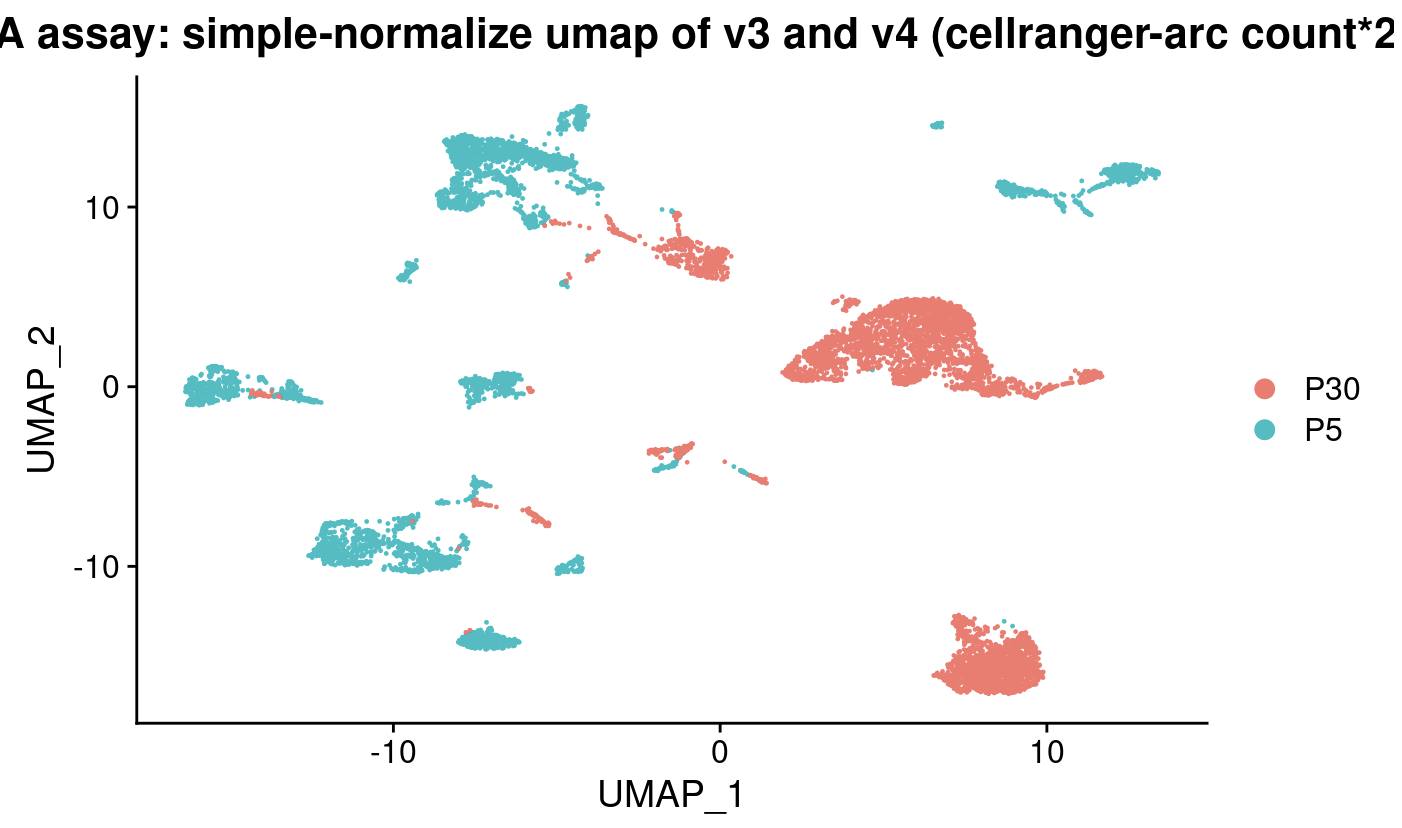
Observe batch effect in peaks assay?
DefaultAssay(mouse_lung_count_filter) <- "peaks"


# Observe batch effect in peaks assay
# q5: top 95% most common features
mouse_lung_count_filter <- FindTopFeatures(mouse_lung_count_filter, min.cutoff = "q5")
mouse_lung_count_filter <- RunTFIDF(mouse_lung_count_filter)
mouse_lung_count_filter <- RunSVD(mouse_lung_count_filter)
mouse_lung_count_filter <- RunUMAP(object = mouse_lung_count_filter,
                                  reduction = "lsi",
                                  reduction.name = "atac_umap",
                                  dims = 2:50)

DimPlot(mouse_lung_count_filter,
        reduction = "atac_umap",
        label = TRUE,
        label.size = 2.5,
        repel = TRUE,
        group.by = "sample") +
  ggtitle("peaks assay: normalize umap (all sample at once)\\n of v3 and v4 (cellranger-arc count*2)")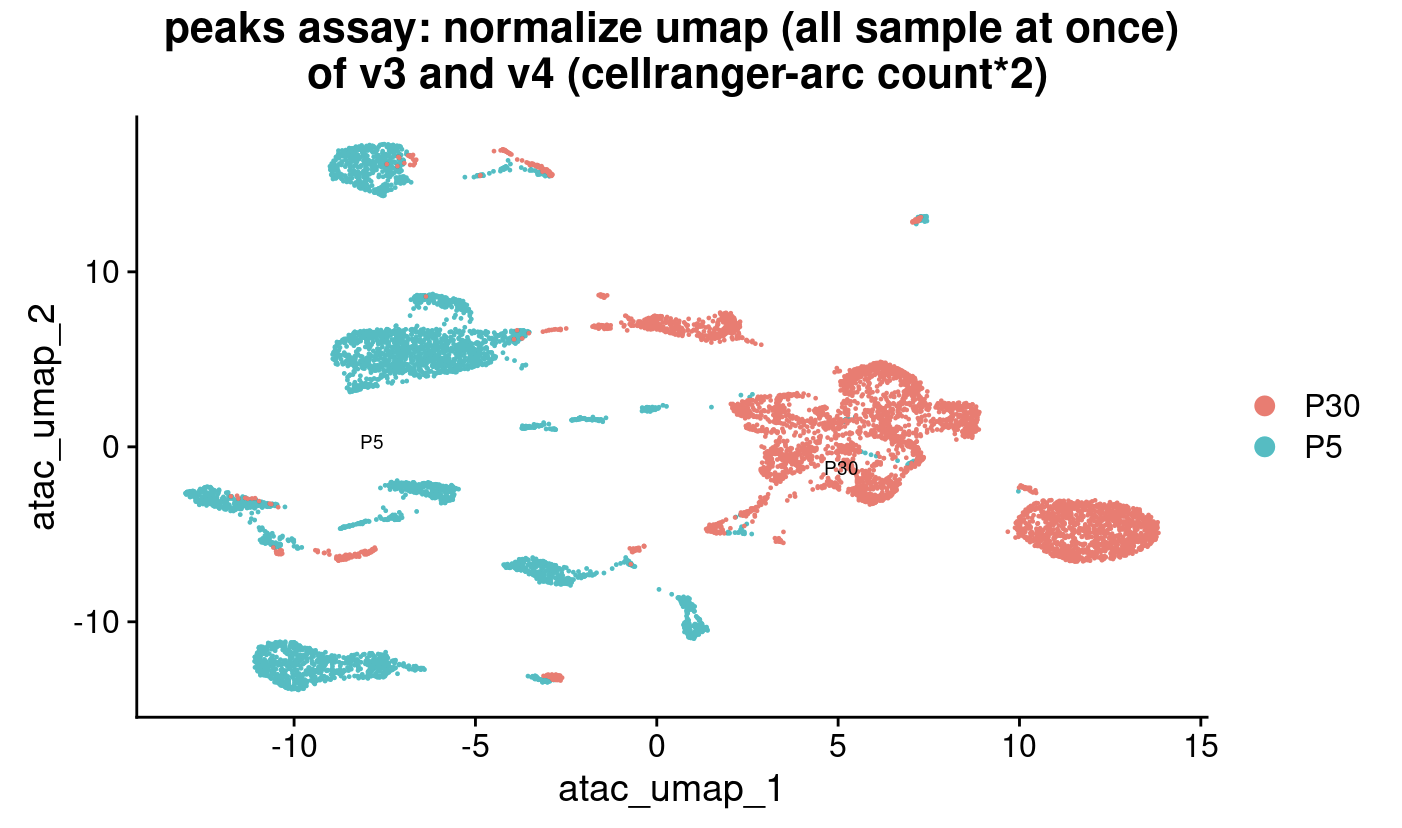
Perform cell cycle scoring
DefaultAssay(mouse_lung_count_filter) <- "RNA"


# Perform cell cycle scoring
seurat_phase_V3andV4 <- CellCycleScoring(mouse_lung_count_filter,
                                 g2m.features = g2m_genes,
                                 s.features = s_genes)

# Perform PCA and color by cell cycle phase
# but first, 確定 Variable features have 有被 set:

#seurat_phase <- FindVariableFeatures(seurat_phase,
#                     selection.method = "vst",
#                     nfeatures = 8000,
#                     verbose = FALSE)


# 測試 regress 前後的差異

# if not regress out cell cycle effect
seurat_phase_V3andV4_NonRegress <- ScaleData(seurat_phase_V3andV4,
                                     features = rownames(seurat_phase_V3andV4))

seurat_phase_V3andV4_NonRegress <- RunPCA(seurat_phase_V3andV4_NonRegress,
                                          features = c(s_genes, g2m_genes))


# if Regress out cell cycle effect
seurat_phase_V3andV4_Regress <- ScaleData(seurat_phase_V3andV4,
                          vars.to.regress = c("S.Score", "G2M.Score"),
                          features = rownames(seurat_phase_V3andV4))
seurat_phase_V3andV4_Regress <- RunPCA(seurat_phase_V3andV4_Regress,
                               features = c(s_genes, g2m_genes))


DimPlot(seurat_phase_V3andV4_NonRegress,
        reduction = "pca",
        group.by= "Phase") +
  ggtitle("v3 and v4: not regress out cell cycle effects")

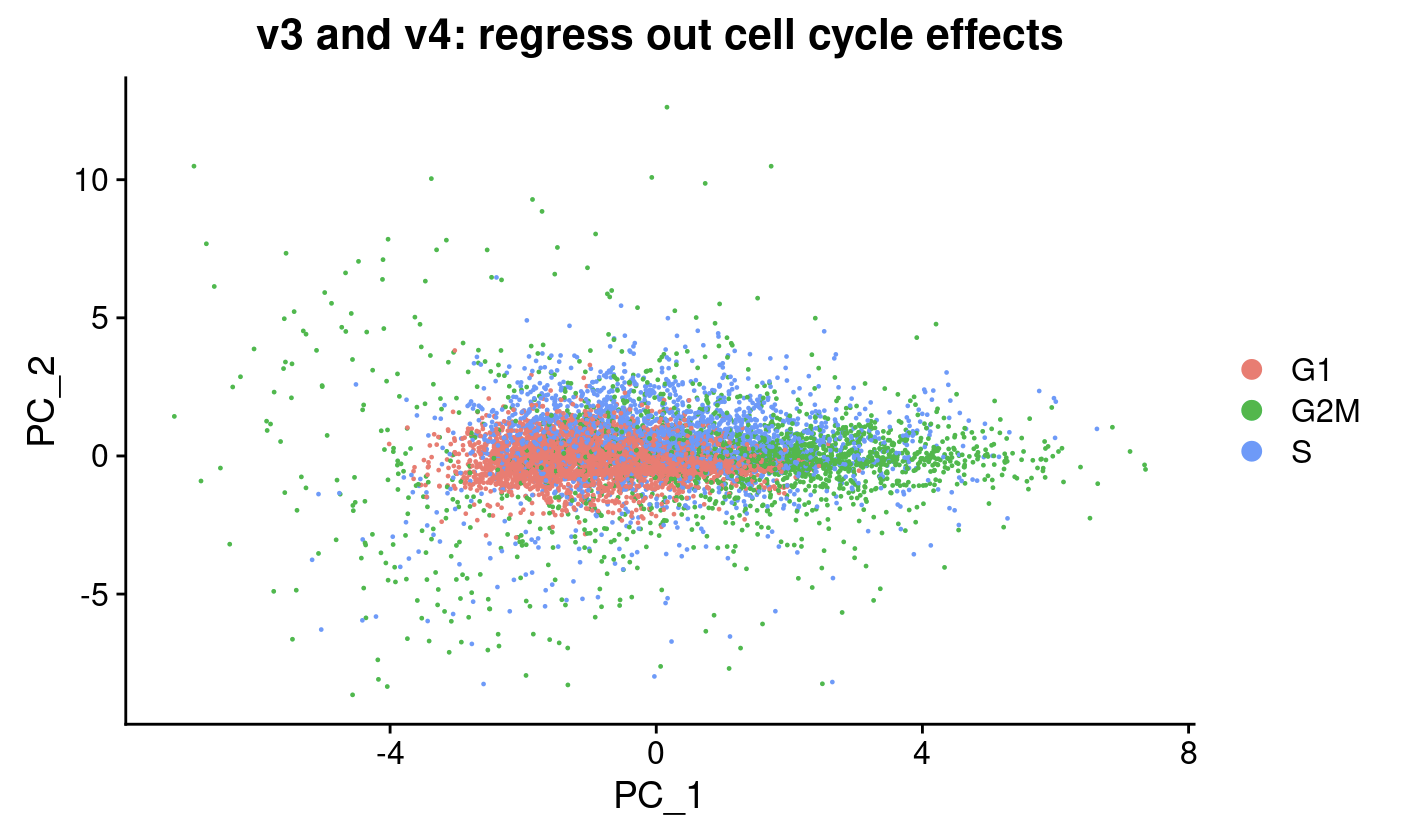
DimPlot(seurat_phase_V3andV4_Regress,
        reduction = "pca",
        group.by= "Phase") +
  ggtitle("v3 and v4: regress out cell cycle effects")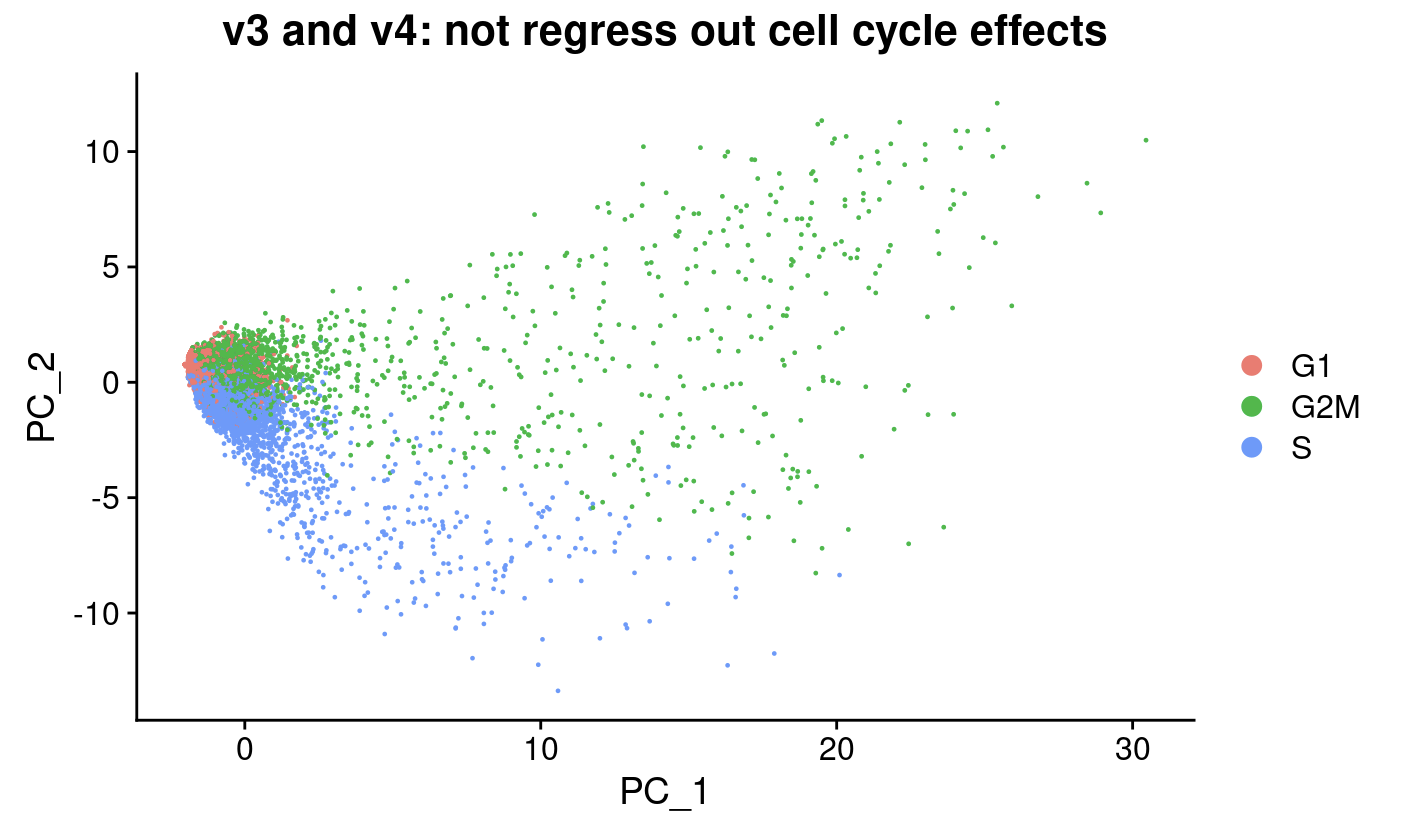
v3 workflow (IntegrateData)
split and SCTransform (regress out unwanted variation)
# 把剛剛 seurat_phase計算的 s_genes與 g2m_genes資料加入到__中
mouse_lung_v3 <- mouse_lung_count_filter
mouse_lung_v3@meta.data <- seurat_phase_V3andV4_Regress@meta.data


DefaultAssay(mouse_lung_v3) <- "RNA"

# split object
split_seurat <- SplitObject(mouse_lung_v3, split.by = "sample")

# SCTransform n=16000 var features for each object
rna.list <- lapply(X = split_seurat, function(x){
   CreateSeuratObject(x@assays$RNA@counts, meta.data = x@meta.data) %>%
   SCTransform(vst.flavor="v2",
               vars.to.regress = c("S.Score", "G2M.Score", "percent.mt"),
               verbose = TRUE,
               ncells = 5000,
               variable.features.n = 16000)
})

# Select the most variable features to use for integration
integ_features <- SelectIntegrationFeatures(object.list = rna.list,
                                            nfeatures = length(rna.list$P5@assays$SCT@var.features))

# Prepare the SCT list object for integration
rna.list <- PrepSCTIntegration(object.list = rna.list,
                                   anchor.features = integ_features)


# perform CCA integration
# find the best buddies or anchors and filter incorrect anchors.
anchors.sct.norm <- FindIntegrationAnchors(object.list = rna.list,
                                           normalization.method = "SCT",
                                           anchor.features = integ_features,
                                           n.trees = 100)

combined.sct_v3 <- IntegrateData(anchorset = anchors.sct.norm,
                              normalization.method = "SCT")

# now the defaultAssay is "integrated"
# if not scaled yet, do:
# combined.sct <- ScaleData(combined.sct)

combined.sct_v3 <- RunPCA(object = combined.sct_v3,
                       reduction.name = "integrated_pca")
combined.sct_v3 <- RunUMAP(combined.sct_v3,
                        dims = 1:50,
                        reduction = "integrated_pca",
                        reduction.name = "integrated_umap")

# Given a merged object with multiple SCT models, this function uses minimum of the median UMI (calculated using the raw UMI counts) of individual objects to reverse the individual SCT regression model using minimum of median UMI as the sequencing depth covariate. The counts slot of the SCT assay is replaced with recorrected counts and the data slot is replaced with log1p of recorrected counts.
combined.sct.consistent_v3 <- PrepSCTFindMarkers(combined.sct_v3,
                                              assay = 'SCT')

DimPlot(combined.sct.consistent_v3,
        label = TRUE,
        reduction = 'integrated_umap',
        label.size = 2.5,
        repel = TRUE,
        group.by = "sample") +
  ggtitle("v3: RNA integrated umap")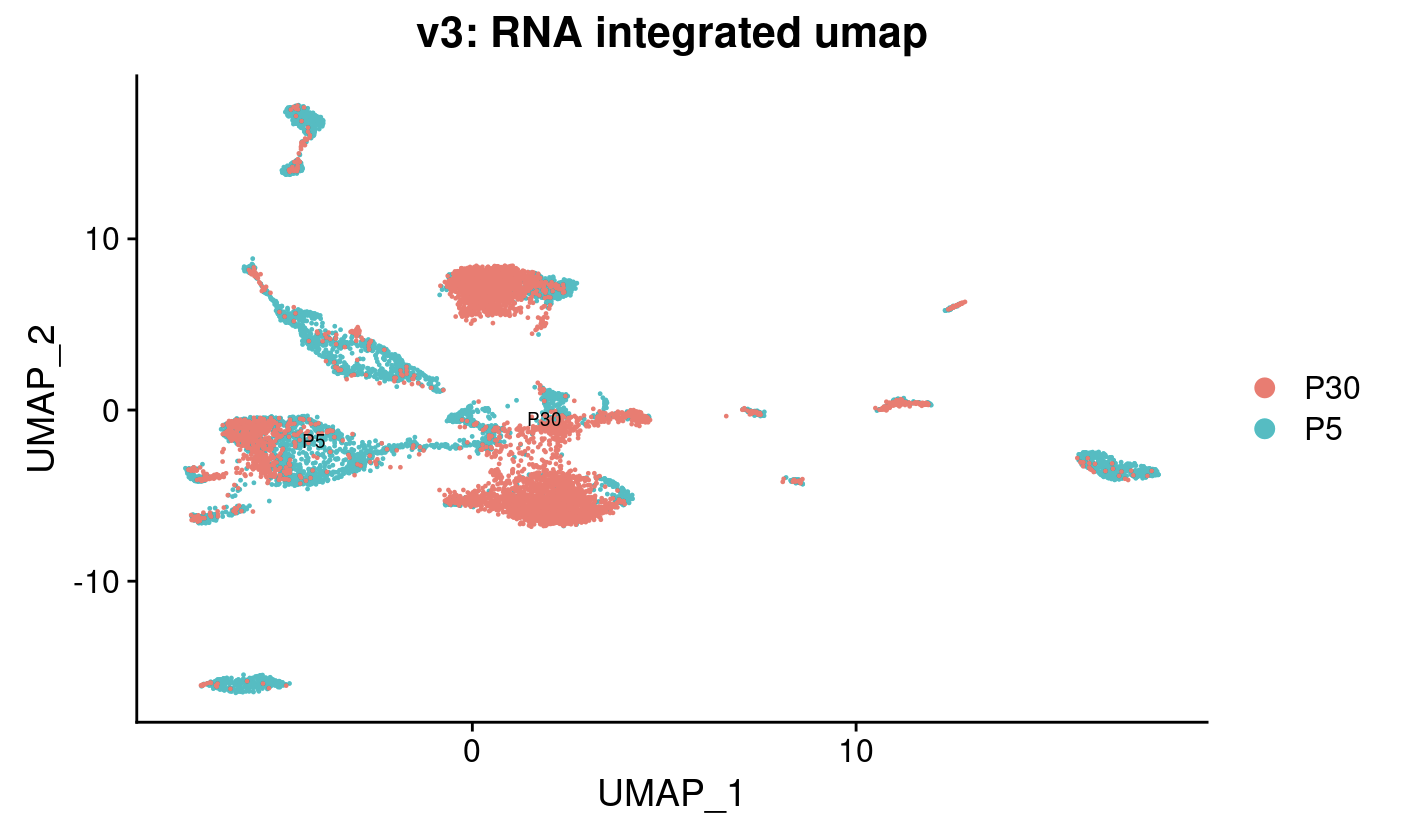
split and normalization (peaks assay)
DefaultAssay(mouse_lung_count_filter) <- "peaks"
DefaultAssay(mouse_lung_v3) <- "peaks"

# split
obj.list <- SplitObject(mouse_lung_v3, split.by = "sample")

# normalization of each
# make sure to keep peak counts > 0
atac.list <- lapply(X = obj.list, function(x){
    peak_keep = which(rowSums(x@assays$peaks@counts) > 0)
    CreateSeuratObject(x@assays$peaks@counts[peak_keep,],
                       meta.data = x@meta.data,
                       assay = 'peaks')   %>%
        FindTopFeatures(min.cutoff = "q5") %>%
        RunTFIDF() %>%
        RunSVD()
})


# integration
# find integration anchors
integration.anchors <- FindIntegrationAnchors(
  object.list = atac.list,
  reduction = "rlsi",
  anchor.features = rownames(atac.list$P5),
  dims = 2:50,
  n.trees = 30)

# integrate LSI embeddings
atac.integrated_v3 <- IntegrateEmbeddings(
                        anchorset = integration.anchors,
                        reductions = mouse_lung_count_filter[["lsi"]],
                        new.reduction.name = "integrated_lsi",
                        dims.to.integrate = 1:50)


atac.integrated_v3 <- RunUMAP(atac.integrated_v3,
                           reduction = 'integrated_lsi',
                           dims = 2:50,
                           reduction.name = "atac_integrated_umap")


DimPlot(atac.integrated_v3,
        reduction = "atac_integrated_umap",
        label = TRUE,
        label.size = 2.5,
        repel = TRUE,
        group.by = "sample") +
  ggtitle("v3: peaks integrated umap")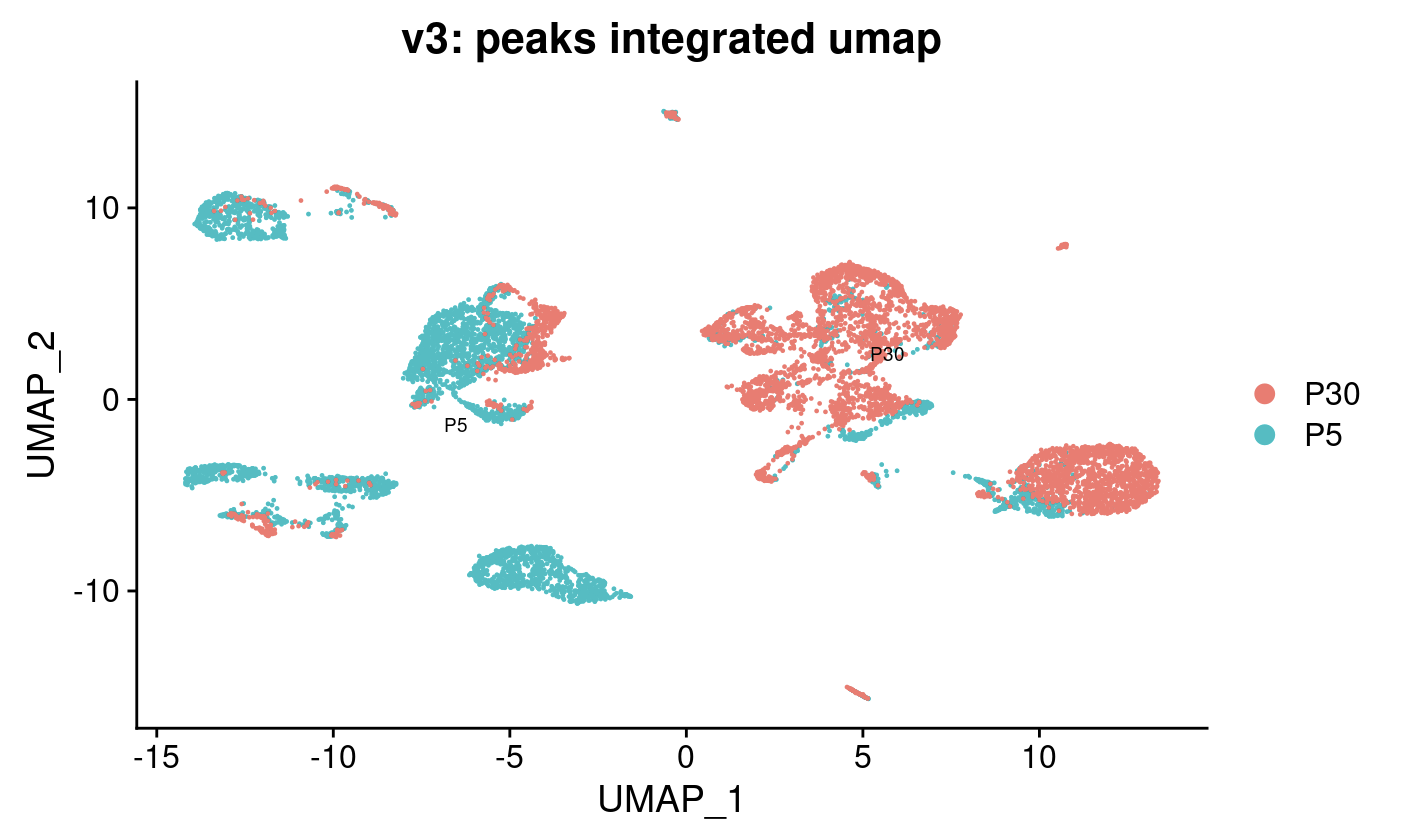
add RNA “integrated assay + reduction” to mouse_lung_filter add peaks “integrated reduction” to mouse_lung_filter
Retain the dimensional reductions needed for the final analysis
# 這邊放入的 SCT 與 integrated 都是 normalize 後的 "data"
mouse_lung_v3[["SCT"]] <- CreateAssayObject(counts = GetAssayData(
                                                              object =  combined.sct.consistent_v3,
                                                              assay = "SCT",
                                                              slot = 'data'))
mouse_lung_v3[["integrated"]] <- CreateAssayObject(counts = GetAssayData(
                                                              object =  combined.sct.consistent_v3,
                                                              assay = "integrated",
                                                              slot = 'data'))

# 要把 "counts" 複製過來
mouse_lung_v3@assays$SCT@counts <- combined.sct.consistent_v3@assays$SCT@counts
mouse_lung_v3@assays$integrated@counts <- combined.sct.consistent_v3@assays$integrated@counts


mouse_lung_v3@reductions <- append(combined.sct.consistent_v3@reductions,
                                   atac.integrated_v3@reductions)


# 重新 normalize peaks assay (why???)
#DefaultAssay(mouse_lung_v3) <- "peaks"

#mouse_lung_v3 %>%
#        FindTopFeatures(min.cutoff = "q5") %>%
#        RunTFIDF() %>%
#        RunSVD()


integrated_multiome_v3 <- mouse_lung_v3
WNN
integrated_multiome_v3 <- FindMultiModalNeighbors(integrated_multiome_v3,
                                               reduction.list = list("integrated_pca",
                                                                     "integrated_lsi"),
                                               dims.list = list(1:50, 2:50),
                                               k.nn = 100)

integrated_multiome_v3 <- RunUMAP(integrated_multiome_v3,
                                nn.name = "weighted.nn",
                                reduction.name = "wnn_umap",
                                return.model=TRUE)
# res = 1
integrated_multiome_v3 <- FindClusters(integrated_multiome_v3,
                                    graph.name = "wsnn",
                                    algorithm = 3,
                                    verbose = FALSE,
                                    resolution = 1)

# WNN clustering
DimPlot(integrated_multiome_v3,
        reduction = "wnn_umap",
        label = TRUE,
        label.size = 2.5,
        repel = TRUE,
        group.by = "sample") +
ggtitle("v3: WNN clustering")

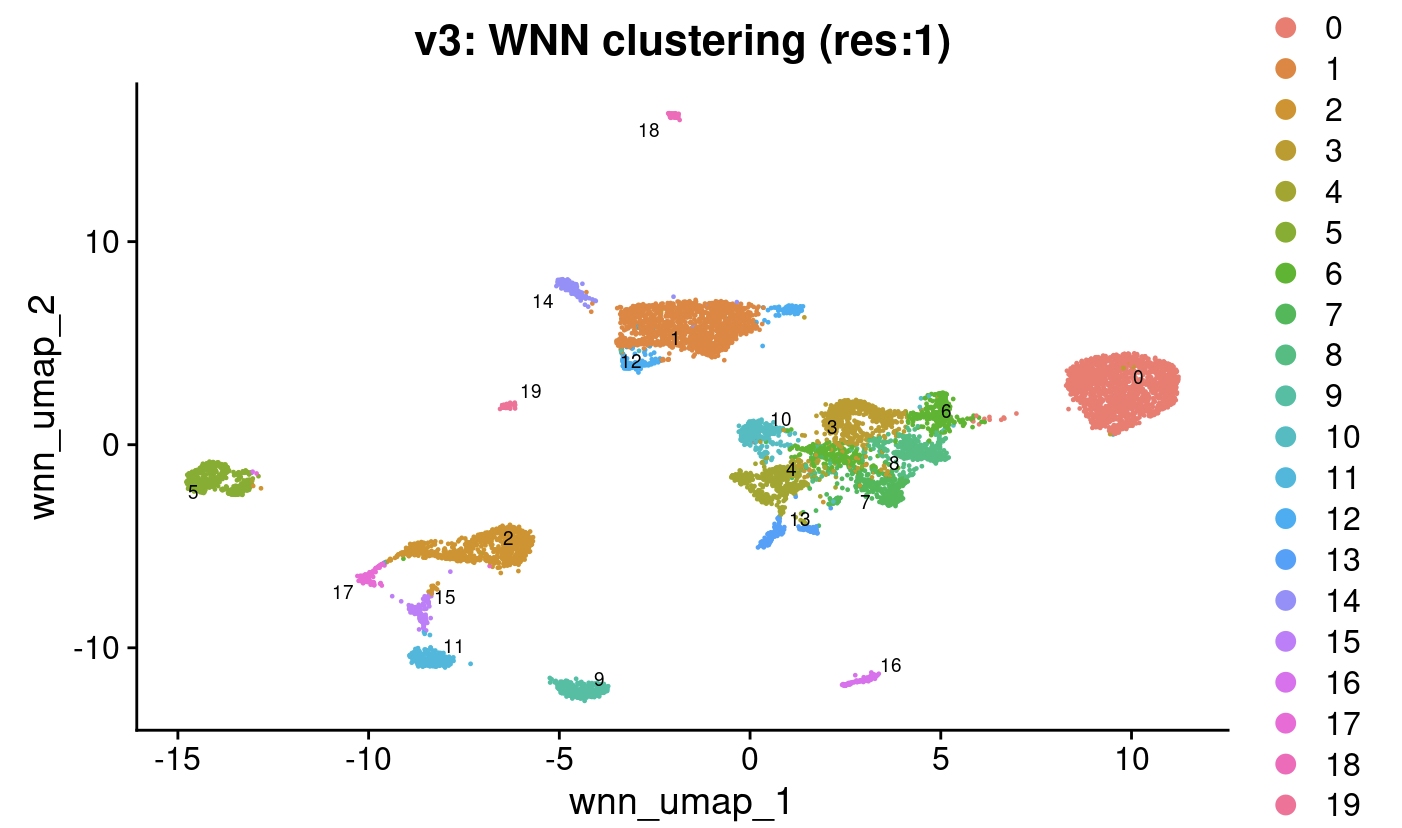
DimPlot(integrated_multiome_v3,
        reduction = "wnn_umap",
        label = TRUE,
        label.size = 2.5,
        repel = TRUE,
        group.by = "wsnn_res.1") +
  ggtitle("v3: WNN clustering (res:1)")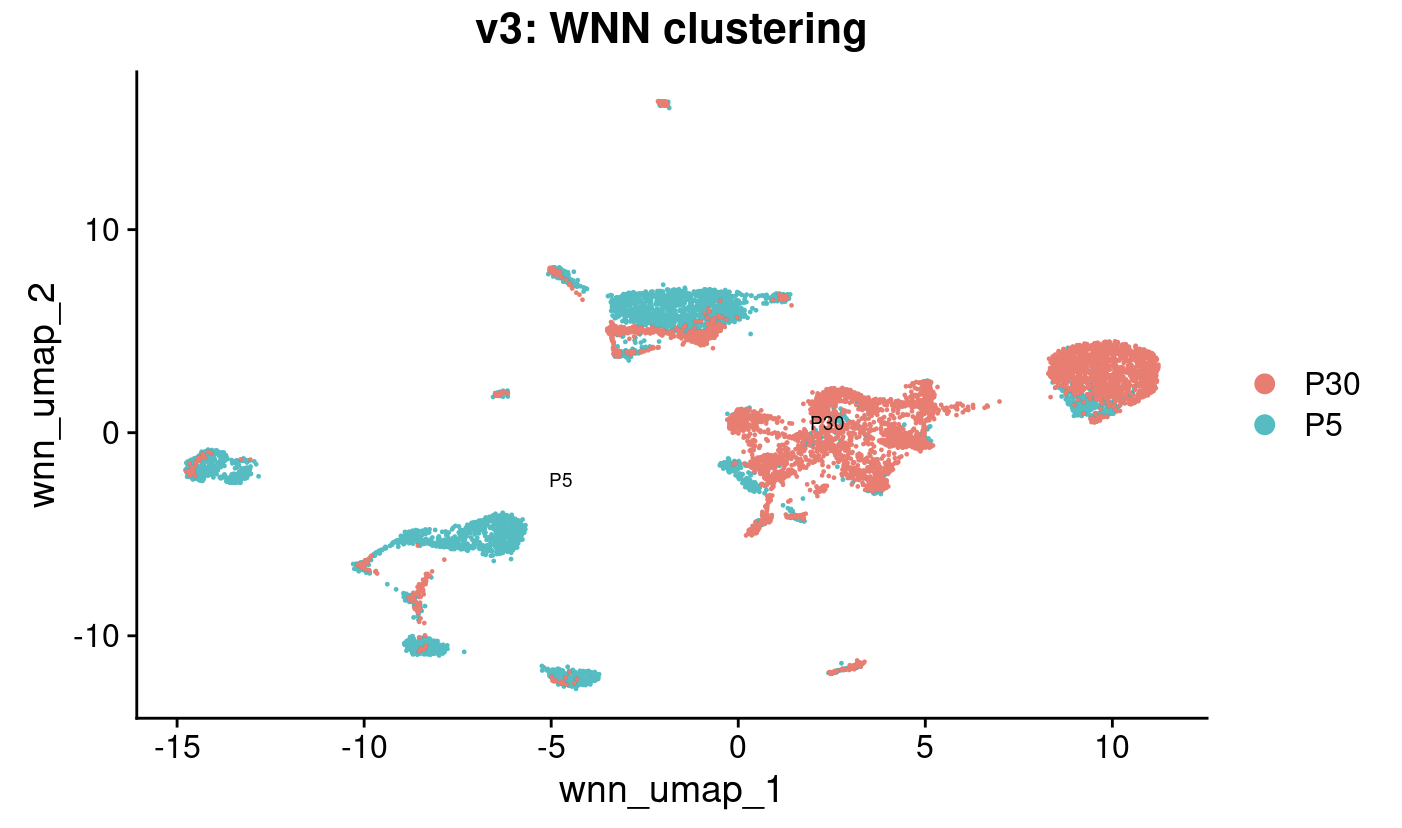
v4 workflow (non-IntegrateData)
SCTransform without IntegrateData
# 把剛剛 seurat_phase計算的 s_genes與 g2m_genes資料加入到__中
mouse_lung_v4 <- mouse_lung_count_filter
mouse_lung_v4@meta.data <- seurat_phase_V3andV4_Regress@meta.data
DefaultAssay(mouse_lung_v4) <- "RNA"


# split object
split_seurat <- SplitObject(mouse_lung_v4, split.by = "sample")

# SCTransform n=16000 var features for each object
rna.list <- lapply(X = split_seurat, function(x){
   CreateSeuratObject(x@assays$RNA@counts, meta.data = x@meta.data) %>%
   SCTransform(vst.flavor="v2",
               vars.to.regress = c("S.Score", "G2M.Score", "percent.mt"),
               verbose = TRUE,
               ncells = 5000,
               variable.features.n = 16000)
})


my_select_features_v4 <- SelectIntegrationFeatures(rna.list,
                                                nfeatures = 16000,
                                                assay = c("SCT","SCT"),
                                                verbose = TRUE)

combined.sct.consistent_v4 <- PrepSCTFindMarkers(merge(rna.list$P5,
                                                       rna.list$P30),
                                                 assay = 'SCT')


DefaultAssay(combined.sct.consistent_v4) <- "SCT"
VariableFeatures(combined.sct.consistent_v4) <- my_select_features_v4

combined.sct.consistent_v4 <- RunPCA(object = combined.sct.consistent_v4,
                                reduction.name = "SCT_pca")

combined.sct.consistent_v4 <- RunUMAP(combined.sct.consistent_v4,
                                 dims = 1:25,
                                 reduction = "SCT_pca",
                                 reduction.name = "SCT_umap")

DimPlot(combined.sct.consistent_v4,
        label = TRUE,
        reduction = 'SCT_umap',
        label.size = 2.5,
        repel = TRUE,
        group.by = "sample") +
  ggtitle("v4: RNA non-integrated umap")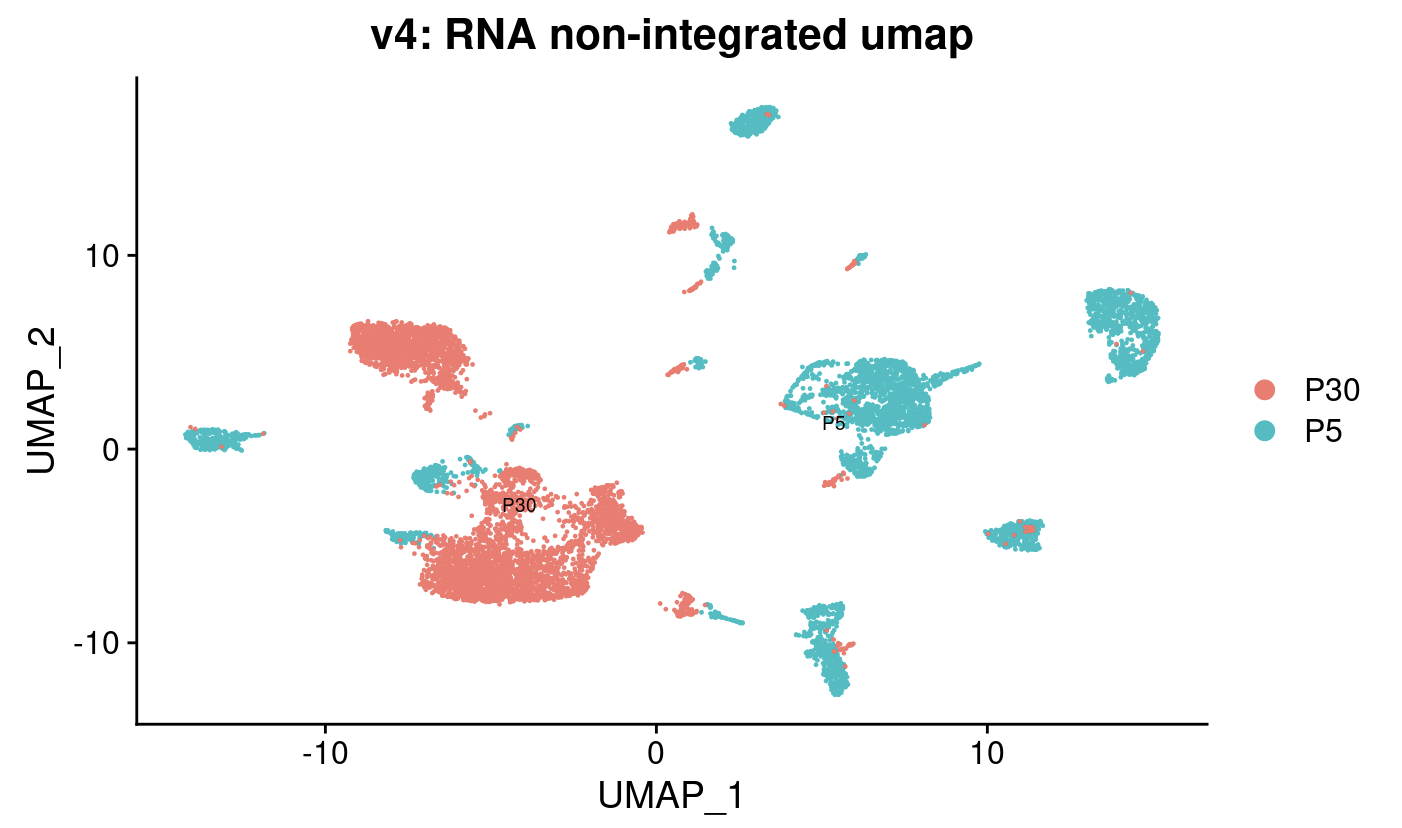
peaks
# split
obj.list <- SplitObject(mouse_lung_v4, split.by = "sample")

# normalization of each
# make sure to keep peak counts > 0
atac.list <- lapply(X = obj.list, function(x){

    peak_keep = which(rowSums(x@assays$peaks@counts) > 0)
    CreateSeuratObject(x@assays$peaks@counts[peak_keep,],
                       meta.data = x@meta.data,
                       assay = 'peaks')   %>%
        FindTopFeatures(min.cutoff = "q5") %>%
        RunTFIDF()
})

atac.integrated_v4 <- merge(atac.list$P5, atac.list$P30)
atac.integrated_v4 <- FindTopFeatures(atac.integrated_v4, min.cutoff = "q5")
atac.integrated_v4 <- RunSVD(atac.integrated_v4)
atac.integrated_v4 <- RunUMAP(atac.integrated_v4,
                           reduction = 'lsi',
                           dims = 2:50,
                           reduction.name = "peaks_umap")


DimPlot(atac.integrated_v4,
        reduction = "peaks_umap",
        label = TRUE,
        label.size = 2.5,
        repel = TRUE,
        group.by = "sample") +
  ggtitle("v4: peaks non-integrated umap")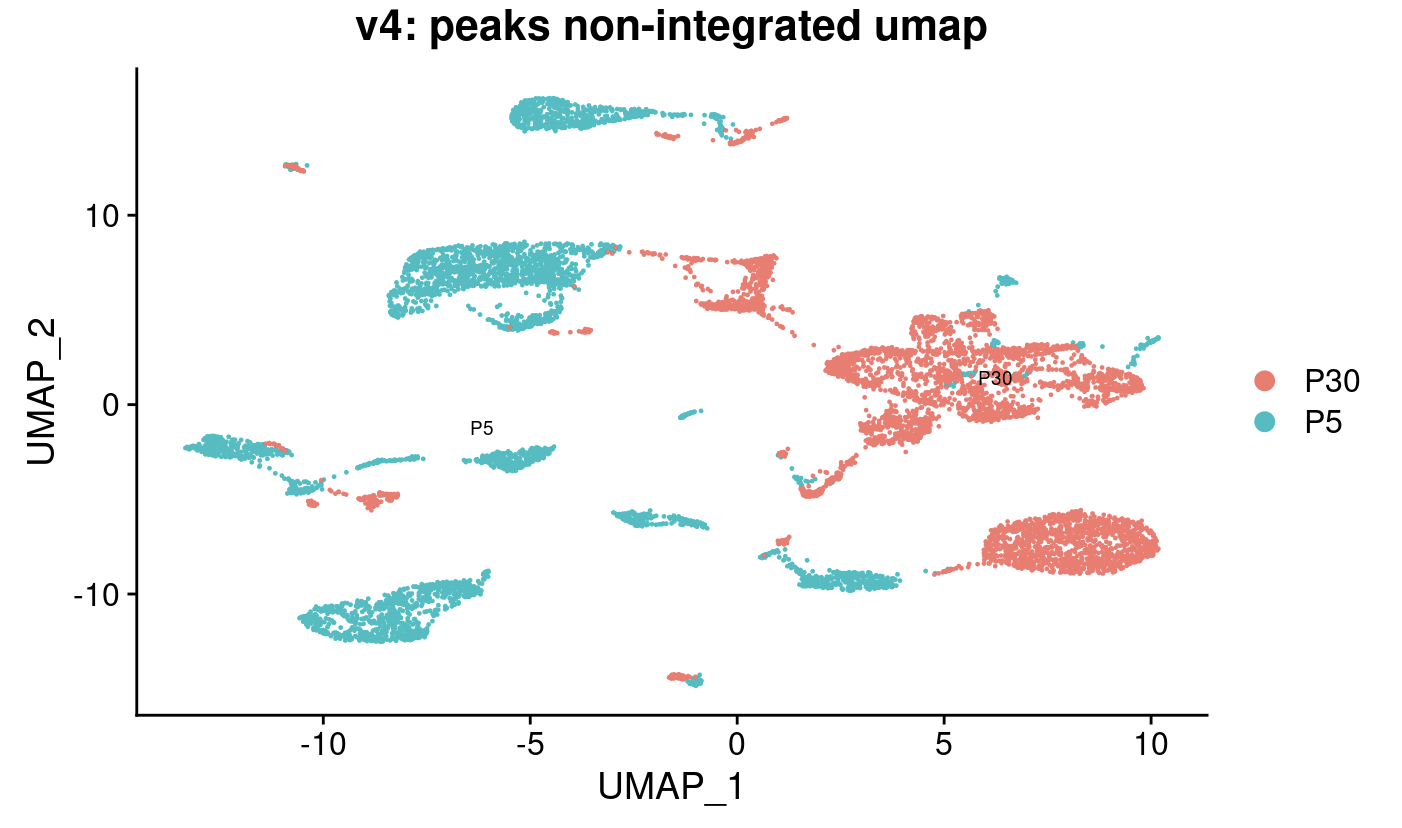
Combine all assays
integrated_multiome_v4 <- atac.integrated_v4


# move just the "data" slots!!!!!!
integrated_multiome_v4[["RNA"]]  <- CreateAssayObject(counts = GetAssayData(
                                                              object =  combined.sct.consistent_v4,
                                                              assay = "RNA",
                                                              slot =  "counts"))
integrated_multiome_v4[["SCT"]]  <- CreateAssayObject(counts = GetAssayData(
                                                              object =  combined.sct.consistent_v4,
                                                              assay = "SCT",
                                                              slot =  "data"))

# 所以這邊最後integrated_multiome裏面
# SCT assay 的 "counts" slot 其實顯示的數值就跟其 "data" slot 一樣

# 要再把 mouse_lung_filter_SCT 的 SCT assay counts slot 複製過來
# RNA assay 就維持原始的 "counts" slot
integrated_multiome_v4@assays$SCT@counts <- combined.sct.consistent_v4@assays$SCT@counts

integrated_multiome_v4@reductions <- append(integrated_multiome_v4@reductions,
                                            combined.sct.consistent_v4@reductions)
WNN analysis
integrated_multiome_v4 <- FindMultiModalNeighbors(integrated_multiome_v4,
                                               reduction.list = list("SCT_pca",
                                                                     "lsi"),
                                               dims.list = list(1:50, 2:50),
                                               k.nn = 100)

integrated_multiome_v4 <- RunUMAP(integrated_multiome_v4,
                                nn.name = "weighted.nn",
                                reduction.name = "wnn_umap",
                                return.model=TRUE)
# res = 1
integrated_multiome_v4 <- FindClusters(integrated_multiome_v4,
                                    graph.name = "wsnn",
                                    algorithm = 3,
                                    verbose = FALSE,
                                    resolution = 1)


# WNN clustering
DimPlot(integrated_multiome_v4,
        reduction = "wnn_umap",
        label = TRUE,
        label.size = 2.5,
        repel = TRUE,
        group.by = "sample") +
ggtitle("v4: WNN clustering")

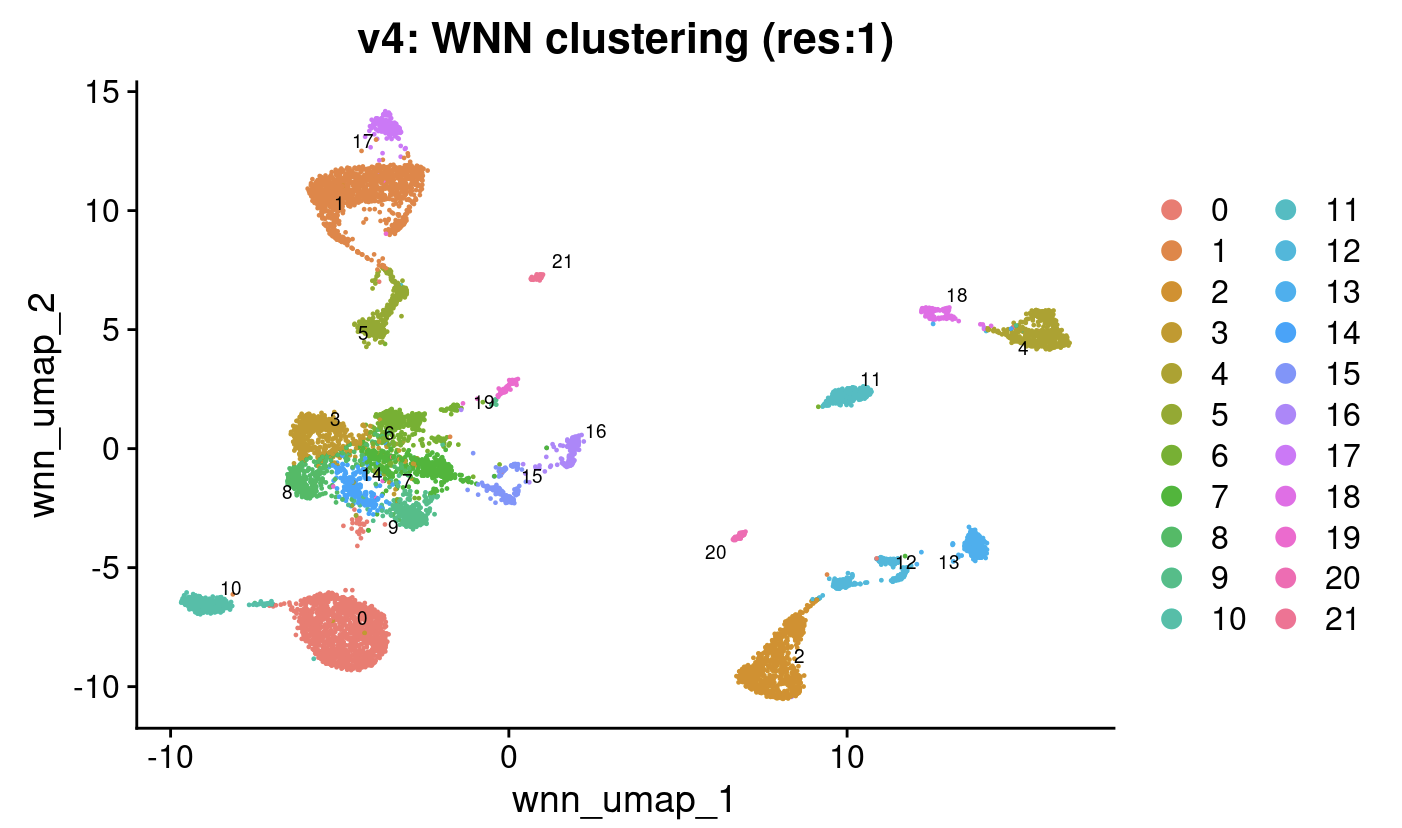
DimPlot(integrated_multiome_v4,
        reduction = "wnn_umap",
        label = TRUE,
        label.size = 2.5,
        repel = TRUE,
        group.by = "wsnn_res.1") +
  ggtitle("v4: WNN clustering (res:1)")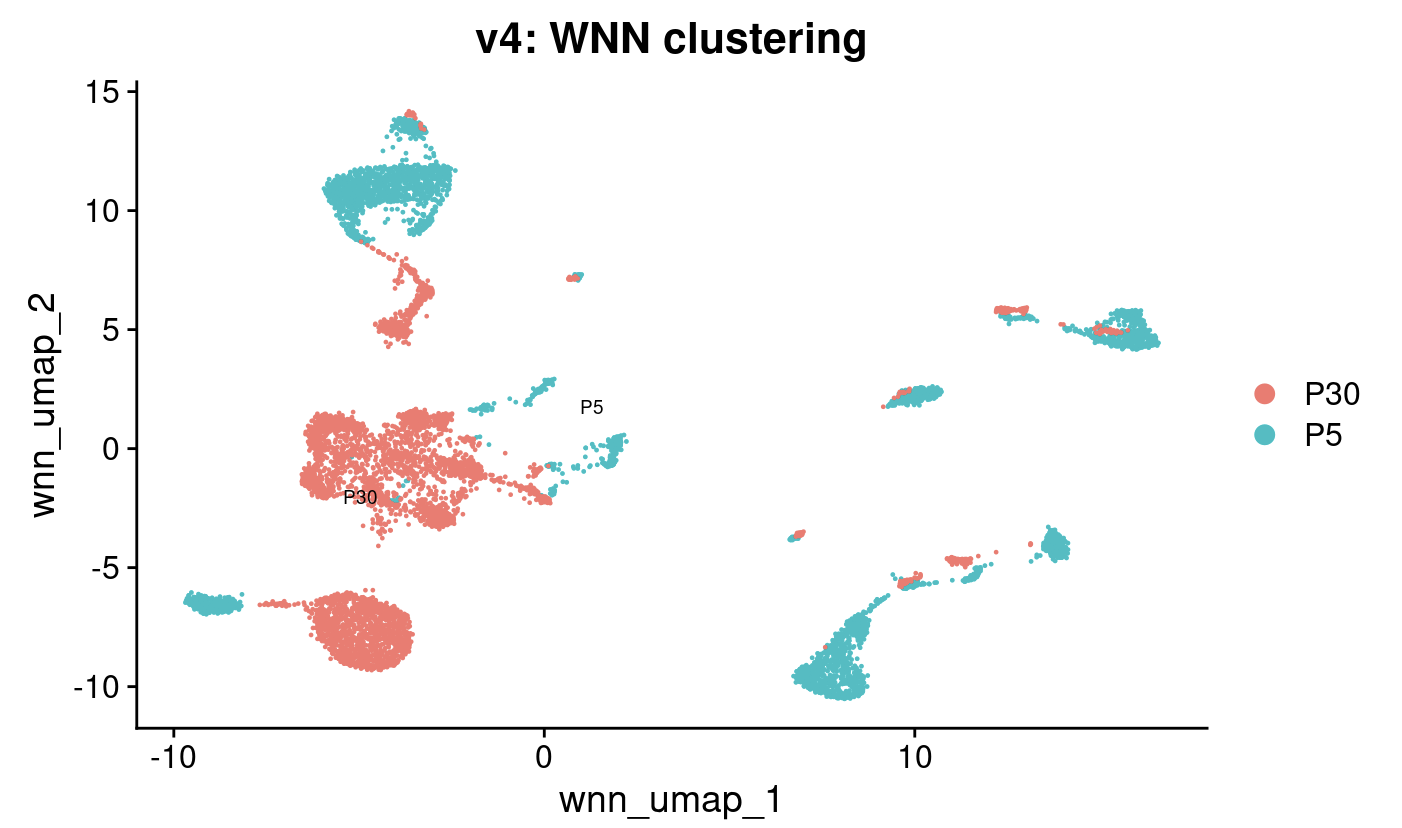
scType celltyping
database preprocess (https://doi.org/10.1242/dev.199512)
filter the database
Negretti <- read_csv("Negretti_mouse_lung_total.csv")
Negretti_filtered <- Negretti[,c(-1)]
Negretti_filtered$pct.diff <- abs(Negretti_filtered$pct.1 - Negretti_filtered$pct.2)


# only keep genes with p_val_adj <= 0.05
Negretti_filtered <- Negretti_filtered[Negretti_filtered$p_val_adj <= 0.05, ]

# only keep genes with pct diffrence >= 0.1
Negretti_filtered <- Negretti_filtered[Negretti_filtered$pct.diff >= 0.1, ]

# 32299 -> 26252 features
separate into positive and negative gene (20 each):
# positive gene list
Negretti_filtered_pos <- Negretti_filtered[Negretti_filtered$avg_log2FC > 0.25,]
Negretti_filtered_pos <- Negretti_filtered_pos[Negretti_filtered_pos$pct.1 > 0.5,]
Negretti_filtered_pos <- Negretti_filtered_pos[Negretti_filtered_pos$pct.2 < 0.5,]

Negretti_filtered_pos <- Negretti_filtered_pos %>%
                         group_by(alias) %>%
                         slice_max(order_by = avg_log2FC,
                                   n = min(table(Negretti_filtered_pos$alias)))
# 20 genes for each cell type


# negative gene
Negretti_filtered_neg <- Negretti_filtered[Negretti_filtered$avg_log2FC < -0.25,]
Negretti_filtered_neg <- Negretti_filtered_neg[Negretti_filtered_neg$pct.1 > 0.1,]
Negretti_filtered_neg <- Negretti_filtered_neg[Negretti_filtered_neg$pct.2 < 0.5,]

table(Negretti_filtered_neg$alias)

Negretti_filtered_neg <- Negretti_filtered_neg %>%
                         group_by(alias) %>%
                         slice_min(order_by = avg_log2FC,
                                   n = min(table(Negretti_filtered_neg$alias)))
# 12 genes for each cell type
reformat
library(unheadr)

Negretti_scTypeDB_pos <- Negretti_filtered_pos[,6:7] %>%
  unwrap_cols(groupingVar = alias, separator = ",")

Negretti_scTypeDB_neg <- Negretti_filtered_neg[,6:7] %>%
  unwrap_cols(groupingVar = alias, separator = ",")

Negretti_scTypeDB <-  merge(Negretti_scTypeDB_pos, Negretti_scTypeDB_neg, by='alias', all=TRUE)


colnames(Negretti_scTypeDB) = c("cellName","geneSymbolmore1","geneSymbolmore2")
Negretti_scTypeDB$tissueType <- "Lung"
Negretti_scTypeDB$shortName <- Negretti_scTypeDB$cellName

# 配合scType的finction,先儲存為.xlsx檔案
write.xlsx(Negretti_scTypeDB, file = "Negretti_scTypeDB.xlsx")
scType
db_ = "./Negretti_scTypeDB.xlsx"
tissue = "Lung"
gs_list = gene_sets_prepare(db_, tissue)DefaultAssay(integrated_multiome_v1) <- "RNA"
DefaultAssay(integrated_multiome_v2) <- "RNA"
DefaultAssay(integrated_multiome_v3) <- "RNA"
DefaultAssay(integrated_multiome_v4) <- "RNA"
# we need the scale.data slot in assay
integrated_multiome_v1 <- ScaleData(object = integrated_multiome_v1)
integrated_multiome_v2 <- NormalizeData(object = integrated_multiome_v2)
integrated_multiome_v2 <- ScaleData(object = integrated_multiome_v2)
integrated_multiome_v3 <- ScaleData(object = integrated_multiome_v3)
integrated_multiome_v4 <- NormalizeData(object = integrated_multiome_v4)
integrated_multiome_v4 <- ScaleData(object = integrated_multiome_v4)
es.max_v1 = sctype_score(scRNAseqData = integrated_multiome_v1[["RNA"]]@scale.data,
scaled = TRUE,
gs = gs_list$gs_positive,
gs2 = gs_list$gs_negative)
es.max_v2 = sctype_score(scRNAseqData = integrated_multiome_v2[["RNA"]]@scale.data,
scaled = TRUE,
gs = gs_list$gs_positive,
gs2 = gs_list$gs_negative)
es.max_v3 = sctype_score(scRNAseqData = integrated_multiome_v3[["RNA"]]@scale.data,
scaled = TRUE,
gs = gs_list$gs_positive,
gs2 = gs_list$gs_negative)
es.max_v4 = sctype_score(scRNAseqData = integrated_multiome_v4[["RNA"]]@scale.data,
scaled = TRUE,
gs = gs_list$gs_positive,
gs2 = gs_list$gs_negative)merge by cluster
# 要改res.XXX

# v1
cL_resutls_v1 = do.call("rbind",
                     lapply(unique(integrated_multiome_v1@meta.data$wsnn_res.1),
                            function(cl){es.max.cl = sort(
    rowSums(
      es.max_v1[ ,rownames(
        integrated_multiome_v1@meta.data[integrated_multiome_v1@meta.data$wsnn_res.1==cl, ])]),
        decreasing = !0)
    head(
      data.frame(
        cluster = cl,
        type = names(es.max.cl),
        scores = es.max.cl,
        ncells = sum(integrated_multiome_v1@meta.data$wsnn_res.1==cl)), 10)
}))

sctype_scores_v1 = cL_resutls_v1 %>% group_by(cluster) %>% top_n(n = 1, wt = scores)


# v2
cL_resutls_v2 = do.call("rbind",
                     lapply(unique(integrated_multiome_v2@meta.data$wsnn_res.1),
                            function(cl){es.max.cl = sort(
    rowSums(
      es.max_v2[ ,rownames(
        integrated_multiome_v2@meta.data[integrated_multiome_v2@meta.data$wsnn_res.1==cl, ])]),
        decreasing = !0)
    head(
      data.frame(
        cluster = cl,
        type = names(es.max.cl),
        scores = es.max.cl,
        ncells = sum(integrated_multiome_v2@meta.data$wsnn_res.1==cl)), 10)
}))

sctype_scores_v2 = cL_resutls_v2 %>% group_by(cluster) %>% top_n(n = 1, wt = scores)


# v3
cL_resutls_v3 = do.call("rbind",
                     lapply(unique(integrated_multiome_v3@meta.data$wsnn_res.1),
                            function(cl){es.max.cl = sort(
    rowSums(
      es.max_v3[ ,rownames(
        integrated_multiome_v3@meta.data[integrated_multiome_v3@meta.data$wsnn_res.1==cl, ])]),
        decreasing = !0)
    head(
      data.frame(
        cluster = cl,
        type = names(es.max.cl),
        scores = es.max.cl,
        ncells = sum(integrated_multiome_v3@meta.data$wsnn_res.1==cl)), 10)
}))

sctype_scores_v3 = cL_resutls_v3 %>% group_by(cluster) %>% top_n(n = 1, wt = scores)


# v4
cL_resutls_v4 = do.call("rbind",
                     lapply(unique(integrated_multiome_v4@meta.data$wsnn_res.1),
                            function(cl){es.max.cl = sort(
    rowSums(
      es.max_v4[ ,rownames(
        integrated_multiome_v4@meta.data[integrated_multiome_v4@meta.data$wsnn_res.1==cl, ])]),
        decreasing = !0)
    head(
      data.frame(
        cluster = cl,
        type = names(es.max.cl),
        scores = es.max.cl,
        ncells = sum(integrated_multiome_v4@meta.data$wsnn_res.1==cl)), 10)
}))

sctype_scores_v4 = cL_resutls_v4 %>% group_by(cluster) %>% top_n(n = 1, wt = scores)
set low-confident clusters (with ScType score < cell number/4 ) to “unknown”
sctype_scores_v1$type[as.numeric(as.character(sctype_scores_v1$scores)) < sctype_scores_v1$ncells/4] = "Unknown"

sctype_scores_v2$type[as.numeric(as.character(sctype_scores_v2$scores)) < sctype_scores_v2$ncells/4] = "Unknown"

sctype_scores_v3$type[as.numeric(as.character(sctype_scores_v3$scores)) < sctype_scores_v3$ncells/4] = "Unknown"

sctype_scores_v4$type[as.numeric(as.character(sctype_scores_v4$scores)) < sctype_scores_v4$ncells/4] = "Unknown"
Import the assigned cell types into the integrated_multiome Seurat object
integrated_multiome_v1$scType_Negretti_DB_RNA = ""
integrated_multiome_v2$scType_Negretti_DB_RNA = ""
integrated_multiome_v3$scType_Negretti_DB_RNA = ""
integrated_multiome_v4$scType_Negretti_DB_RNA = ""


# 要改integrated_snn_res.XXX
# v1
for(j in unique(sctype_scores_v1$cluster)){
  cl_type = sctype_scores_v1[sctype_scores_v1$cluster==j,]
  integrated_multiome_v1@meta.data$scType_Negretti_DB_RNA[integrated_multiome_v1@meta.data$wsnn_res.1 == j] = as.character(cl_type$type[1])
}

# 按照 Negretti paper 的方式排列 cell type,使 label 的排序與 Negretti 一致
Idents(integrated_multiome_v1) <- "scType_Negretti_DB_RNA"
integrated_multiome_v1@active.ident <- factor(integrated_multiome_v1@active.ident,
                            levels=c("Meso_Cardiomyocyte",
                                     "Meso_Smooth_Muscle",
                                     "Meso_Mesothelium",
                                     "Meso_Pericyte",
                                     "Meso_Adventitial_FB",
                                     "Meso_Myofibroblast",
                                     "Meso_Prolif_Myo_FB",
                                     "Meso_Wnt2_FB",
                                     "Meso_Prolif_Wnt2_FB",
                                     "Endo_Lymphatic",
                                     "Endo_aCap",
                                     "Endo_gCap",
                                     "Endo_Prolif_gCap",
                                     "Endo_Venous_maEC",
                                     "Endo_Arterial_maEC",
                                     "Epi_Neuroendocrine",
                                     "Epi_Secretory",
                                     "Epi_Cilliated",
                                     "Epi_Mki67_AT2",
                                     "Epi_AT2",
                                     "Epi_AT1",
                                     "Epi_Transitional",
                                     "Epi_EarlyEpithelium",
                                     "Unknown"))


# v2
for(j in unique(sctype_scores_v2$cluster)){
  cl_type = sctype_scores_v2[sctype_scores_v2$cluster==j,]
  integrated_multiome_v2@meta.data$scType_Negretti_DB_RNA[integrated_multiome_v2@meta.data$wsnn_res.1 == j] = as.character(cl_type$type[1])
}

# 按照 Negretti paper 的方式排列 cell type,使 label 的排序與 Negretti 一致
Idents(integrated_multiome_v2) <- "scType_Negretti_DB_RNA"
integrated_multiome_v2@active.ident <- factor(integrated_multiome_v2@active.ident,
                            levels=c("Meso_Cardiomyocyte",
                                     "Meso_Smooth_Muscle",
                                     "Meso_Mesothelium",
                                     "Meso_Pericyte",
                                     "Meso_Adventitial_FB",
                                     "Meso_Myofibroblast",
                                     "Meso_Prolif_Myo_FB",
                                     "Meso_Wnt2_FB",
                                     "Meso_Prolif_Wnt2_FB",
                                     "Endo_Lymphatic",
                                     "Endo_aCap",
                                     "Endo_gCap",
                                     "Endo_Prolif_gCap",
                                     "Endo_Venous_maEC",
                                     "Endo_Arterial_maEC",
                                     "Epi_Neuroendocrine",
                                     "Epi_Secretory",
                                     "Epi_Cilliated",
                                     "Epi_Mki67_AT2",
                                     "Epi_AT2",
                                     "Epi_AT1",
                                     "Epi_Transitional",
                                     "Epi_EarlyEpithelium",
                                     "Unknown"))


# v3
for(j in unique(sctype_scores_v3$cluster)){
  cl_type = sctype_scores_v3[sctype_scores_v3$cluster==j,]
  integrated_multiome_v3@meta.data$scType_Negretti_DB_RNA[integrated_multiome_v3@meta.data$wsnn_res.1 == j] = as.character(cl_type$type[1])
}

# 按照 Negretti paper 的方式排列 cell type,使 label 的排序與 Negretti 一致
Idents(integrated_multiome_v3) <- "scType_Negretti_DB_RNA"
integrated_multiome_v3@active.ident <- factor(integrated_multiome_v3@active.ident,
                            levels=c("Meso_Cardiomyocyte",
                                     "Meso_Smooth_Muscle",
                                     "Meso_Mesothelium",
                                     "Meso_Pericyte",
                                     "Meso_Adventitial_FB",
                                     "Meso_Myofibroblast",
                                     "Meso_Prolif_Myo_FB",
                                     "Meso_Wnt2_FB",
                                     "Meso_Prolif_Wnt2_FB",
                                     "Endo_Lymphatic",
                                     "Endo_aCap",
                                     "Endo_gCap",
                                     "Endo_Prolif_gCap",
                                     "Endo_Venous_maEC",
                                     "Endo_Arterial_maEC",
                                     "Epi_Neuroendocrine",
                                     "Epi_Secretory",
                                     "Epi_Cilliated",
                                     "Epi_Mki67_AT2",
                                     "Epi_AT2",
                                     "Epi_AT1",
                                     "Epi_Transitional",
                                     "Epi_EarlyEpithelium",
                                     "Unknown"))


# v4
for(j in unique(sctype_scores_v4$cluster)){
  cl_type = sctype_scores_v4[sctype_scores_v4$cluster==j,]
  integrated_multiome_v4@meta.data$scType_Negretti_DB_RNA[integrated_multiome_v4@meta.data$wsnn_res.1 == j] = as.character(cl_type$type[1])
}

# 按照 Negretti paper 的方式排列 cell type,使 label 的排序與 Negretti 一致
Idents(integrated_multiome_v4) <- "scType_Negretti_DB_RNA"
integrated_multiome_v4@active.ident <- factor(integrated_multiome_v4@active.ident,
                            levels=c("Meso_Cardiomyocyte",
                                     "Meso_Smooth_Muscle",
                                     "Meso_Mesothelium",
                                     "Meso_Pericyte",
                                     "Meso_Adventitial_FB",
                                     "Meso_Myofibroblast",
                                     "Meso_Prolif_Myo_FB",
                                     "Meso_Wnt2_FB",
                                     "Meso_Prolif_Wnt2_FB",
                                     "Endo_Lymphatic",
                                     "Endo_aCap",
                                     "Endo_gCap",
                                     "Endo_Prolif_gCap",
                                     "Endo_Venous_maEC",
                                     "Endo_Arterial_maEC",
                                     "Epi_Neuroendocrine",
                                     "Epi_Secretory",
                                     "Epi_Cilliated",
                                     "Epi_Mki67_AT2",
                                     "Epi_AT2",
                                     "Epi_AT1",
                                     "Epi_Transitional",
                                     "Epi_EarlyEpithelium",
                                     "Unknown"))


# assign a new column "celltype" (epithelium, endothelium and mesenchyme)
library(stringr)

# v1
integrated_multiome_v1$celltype <- integrated_multiome_v1$scType_Negretti_DB_RNA
integrated_multiome_v1$celltype[which(str_detect(integrated_multiome_v1$celltype, "^Epi_"))] <-
"Epithelium"
integrated_multiome_v1$celltype[which(str_detect(integrated_multiome_v1$celltype, "^Endo_"))] <- "Endothelium"
integrated_multiome_v1$celltype[which(str_detect(integrated_multiome_v1$celltype, "^Meso_"))] <- "Mesenchyme"


# v2
integrated_multiome_v2$celltype <- integrated_multiome_v2$scType_Negretti_DB_RNA
integrated_multiome_v2$celltype[which(str_detect(integrated_multiome_v2$celltype, "^Epi_"))] <-
"Epithelium"
integrated_multiome_v2$celltype[which(str_detect(integrated_multiome_v2$celltype, "^Endo_"))] <- "Endothelium"
integrated_multiome_v2$celltype[which(str_detect(integrated_multiome_v2$celltype, "^Meso_"))] <- "Mesenchyme"


# v3
integrated_multiome_v3$celltype <- integrated_multiome_v3$scType_Negretti_DB_RNA
integrated_multiome_v3$celltype[which(str_detect(integrated_multiome_v3$celltype, "^Epi_"))] <-
"Epithelium"
integrated_multiome_v3$celltype[which(str_detect(integrated_multiome_v3$celltype, "^Endo_"))] <- "Endothelium"
integrated_multiome_v3$celltype[which(str_detect(integrated_multiome_v3$celltype, "^Meso_"))] <- "Mesenchyme"


# v4
integrated_multiome_v4$celltype <- integrated_multiome_v4$scType_Negretti_DB_RNA
integrated_multiome_v4$celltype[which(str_detect(integrated_multiome_v4$celltype, "^Epi_"))] <-
"Epithelium"
integrated_multiome_v4$celltype[which(str_detect(integrated_multiome_v4$celltype, "^Endo_"))] <- "Endothelium"
integrated_multiome_v4$celltype[which(str_detect(integrated_multiome_v4$celltype, "^Meso_"))] <- "Mesenchyme"
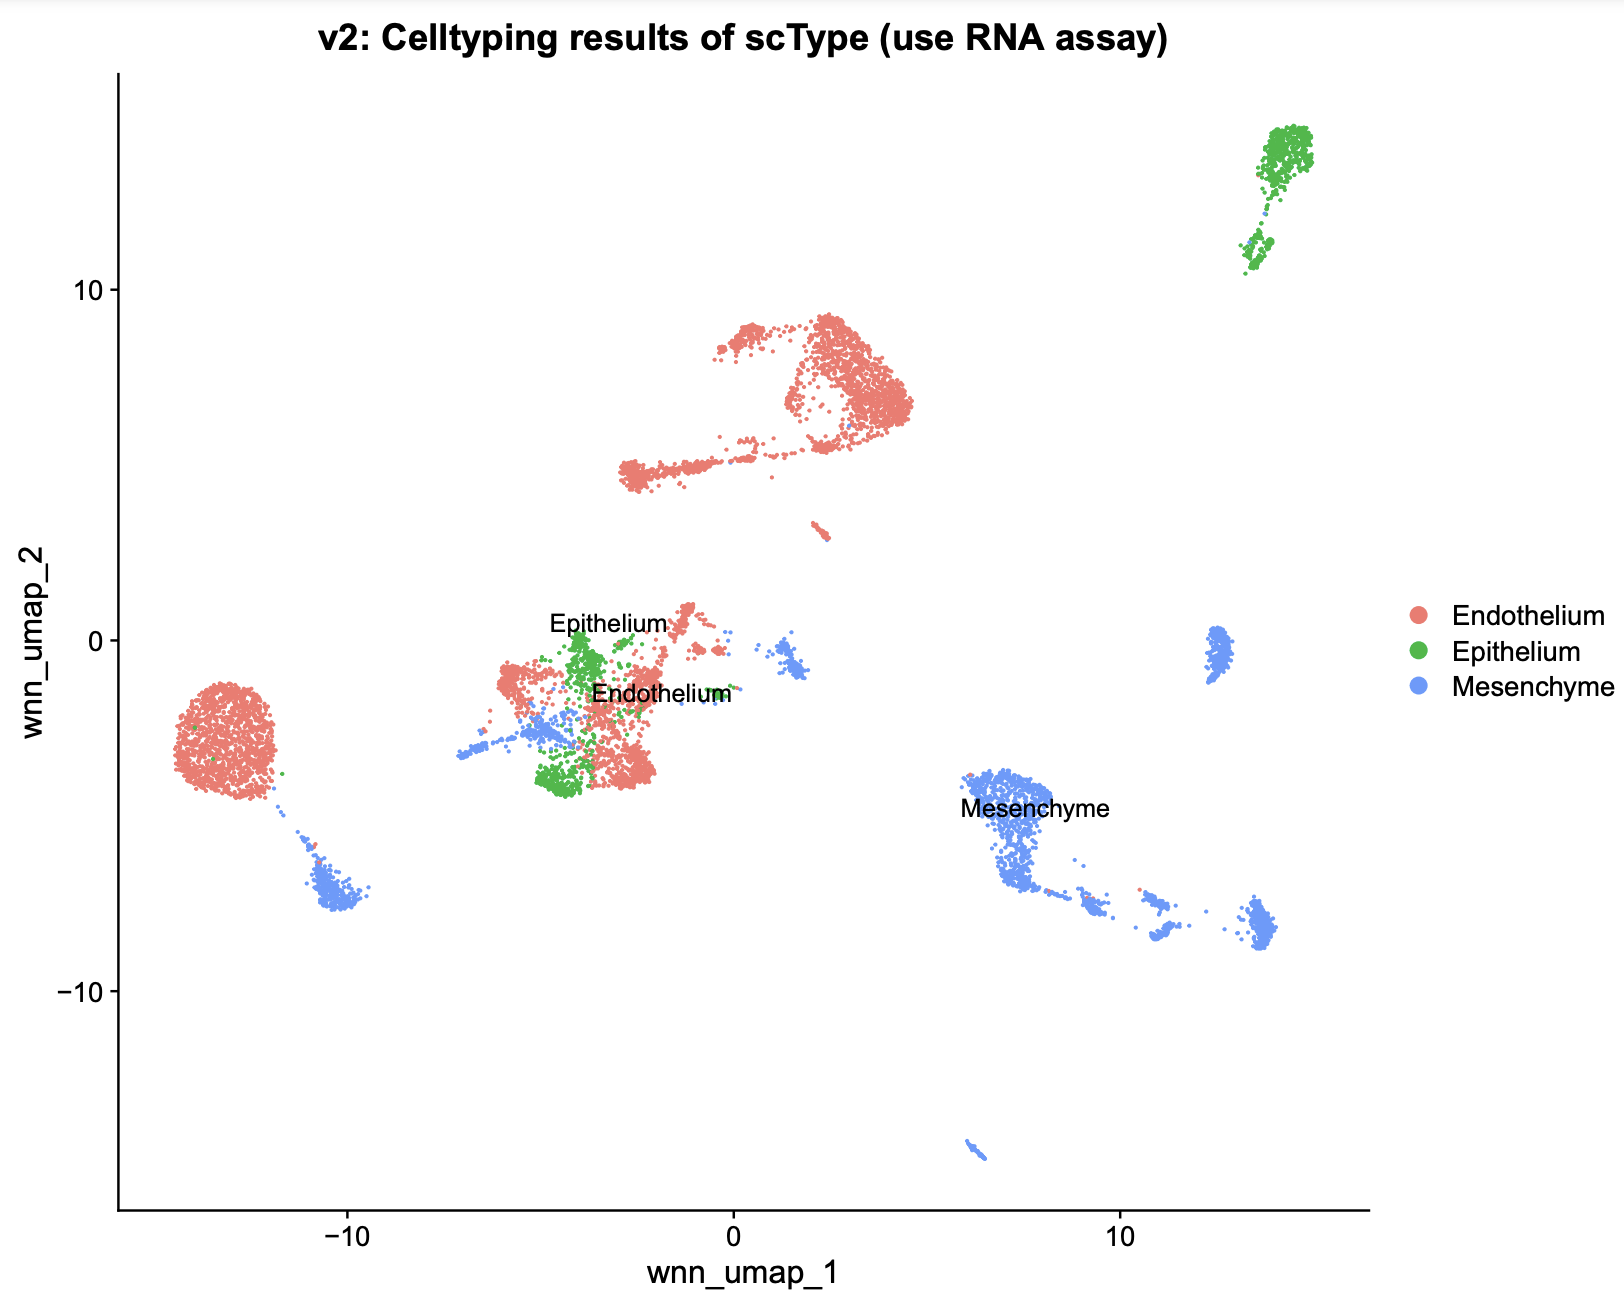
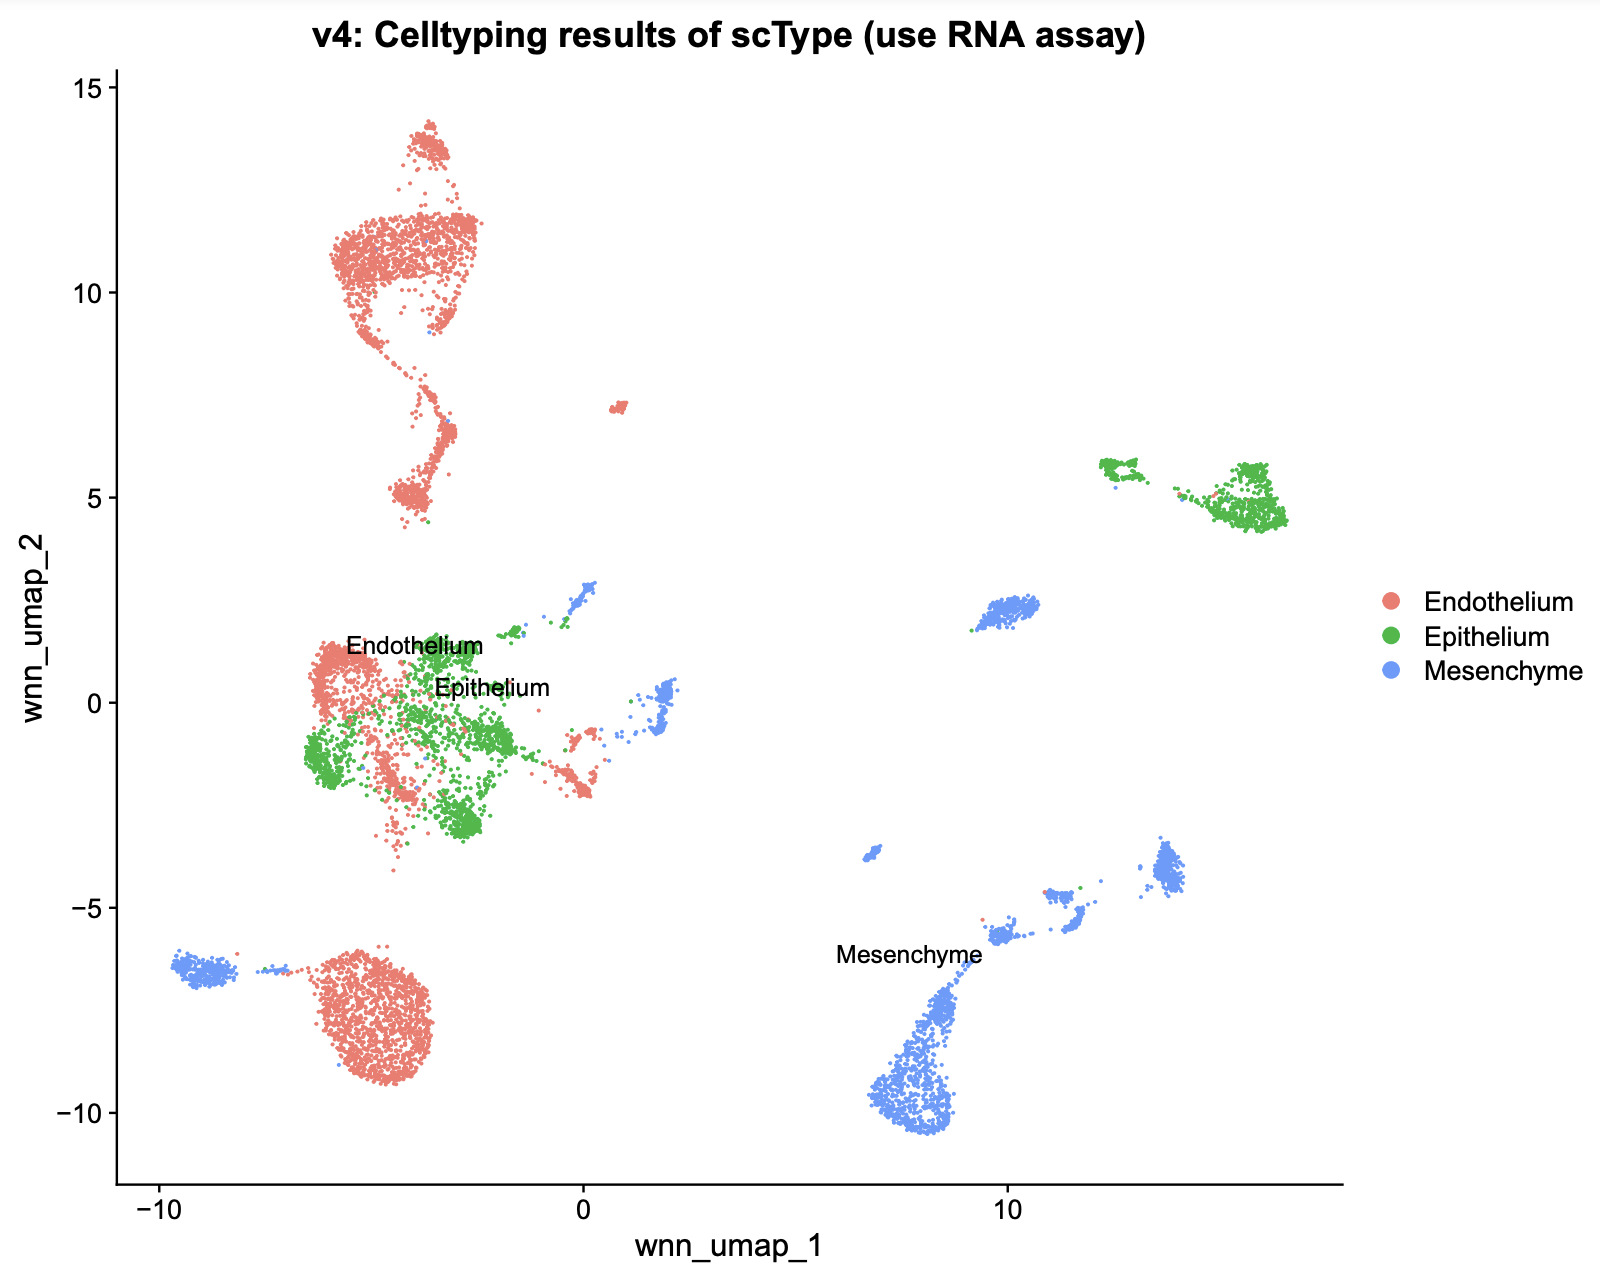
Visualization
pdf(file = "scType_RNAassay_result_v1.pdf", height = 8, width = 10)
DimPlot(integrated_multiome_v1,
        reduction = "wnn_umap",
        label = TRUE,
        repel = TRUE,
        group.by = "celltype") +
  ggtitle("v1: Celltyping results of scType (use RNA assay)")
dev.off()


pdf(file = "scType_RNAassay_result_v2.pdf", height = 8, width = 10)
DimPlot(integrated_multiome_v2,
        reduction = "wnn_umap",
        label = TRUE,
        repel = TRUE,
        group.by = "celltype") +
  ggtitle("v2: Celltyping results of scType (use RNA assay)")
dev.off()

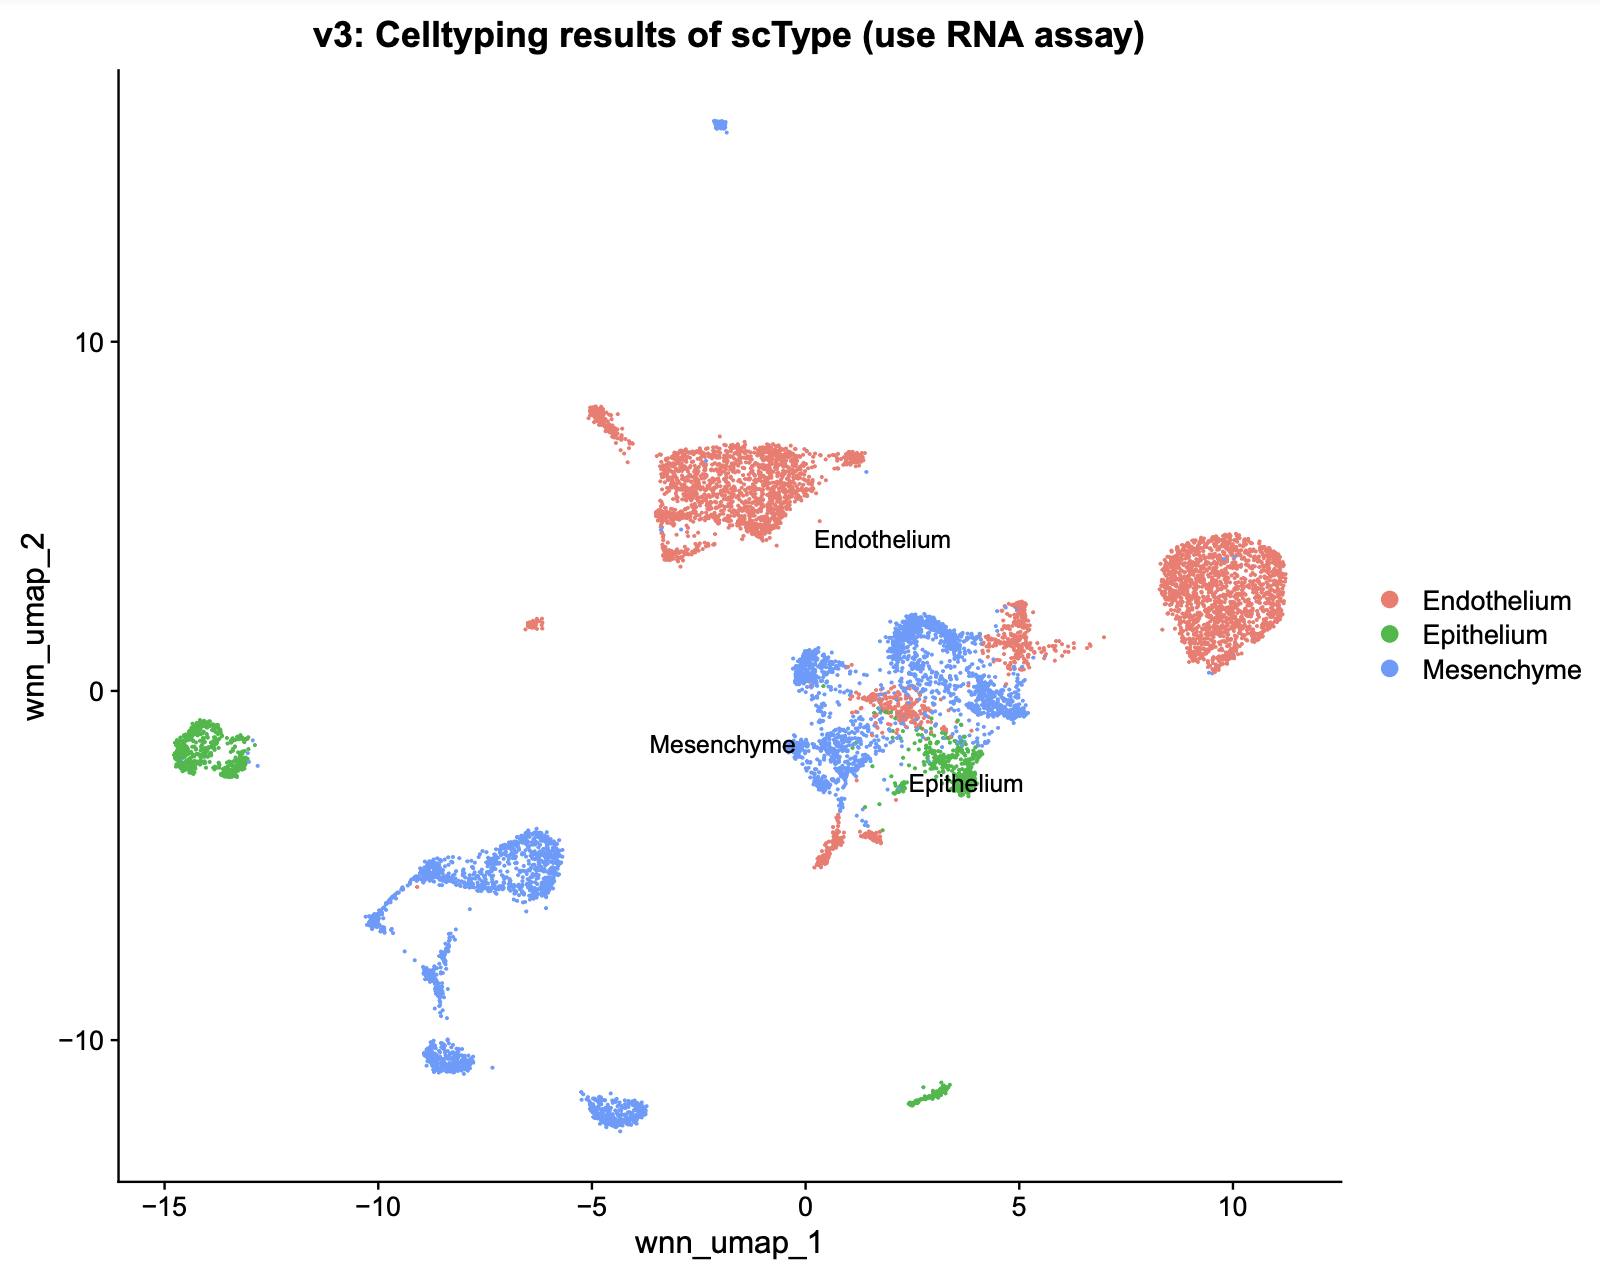
pdf(file = "scType_RNAassay_result_v3.pdf", height = 8, width = 10)
DimPlot(integrated_multiome_v3,
        reduction = "wnn_umap",
        label = TRUE,
        repel = TRUE,
        group.by = "celltype") +
  ggtitle("v3: Celltyping results of scType (use RNA assay)")
dev.off()

pdf(file = "scType_RNAassay_result_v4.pdf", height = 8, width = 10)
DimPlot(integrated_multiome_v4,
        reduction = "wnn_umap",
        label = TRUE,
        repel = TRUE,
        group.by = "celltype") +
  ggtitle("v4: Celltyping results of scType (use RNA assay)")
dev.off()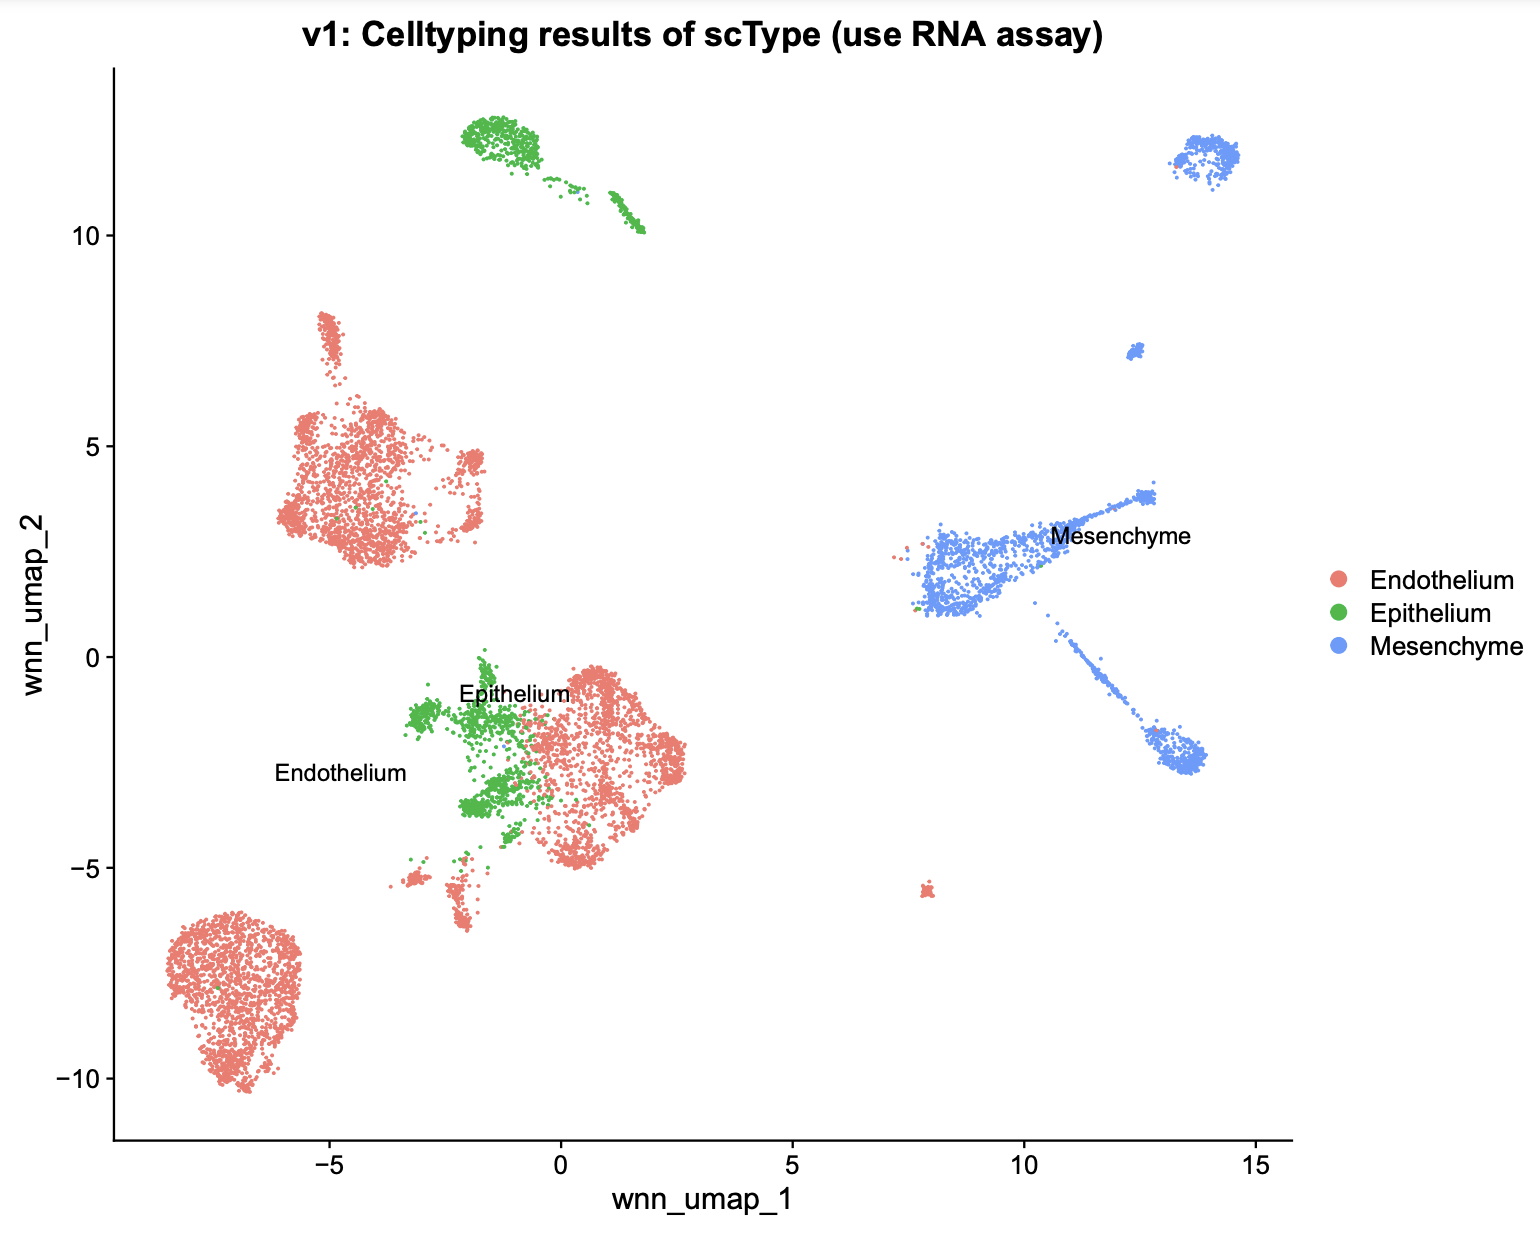
Comparison
library(ggvenn)
df_v1 <- as.data.frame(integrated_multiome_v1$celltype)
df_v2 <- as.data.frame(integrated_multiome_v2$celltype)
df_v3 <- as.data.frame(integrated_multiome_v3$celltype)
df_v4 <- as.data.frame(integrated_multiome_v4$celltype)


df_v1$cells <- rownames(df_v1)
df_v2$cells <- rownames(df_v2)
df_v3$cells <- rownames(df_v3)
df_v4$cells <- rownames(df_v4)


A <-list("v1" = df_v1$cells,
         "v2" = df_v2$cells,
         "v3" = df_v3$cells,
         "v4" = df_v4$cells)

# create venn diagram and display all the sets
ggvenn(A)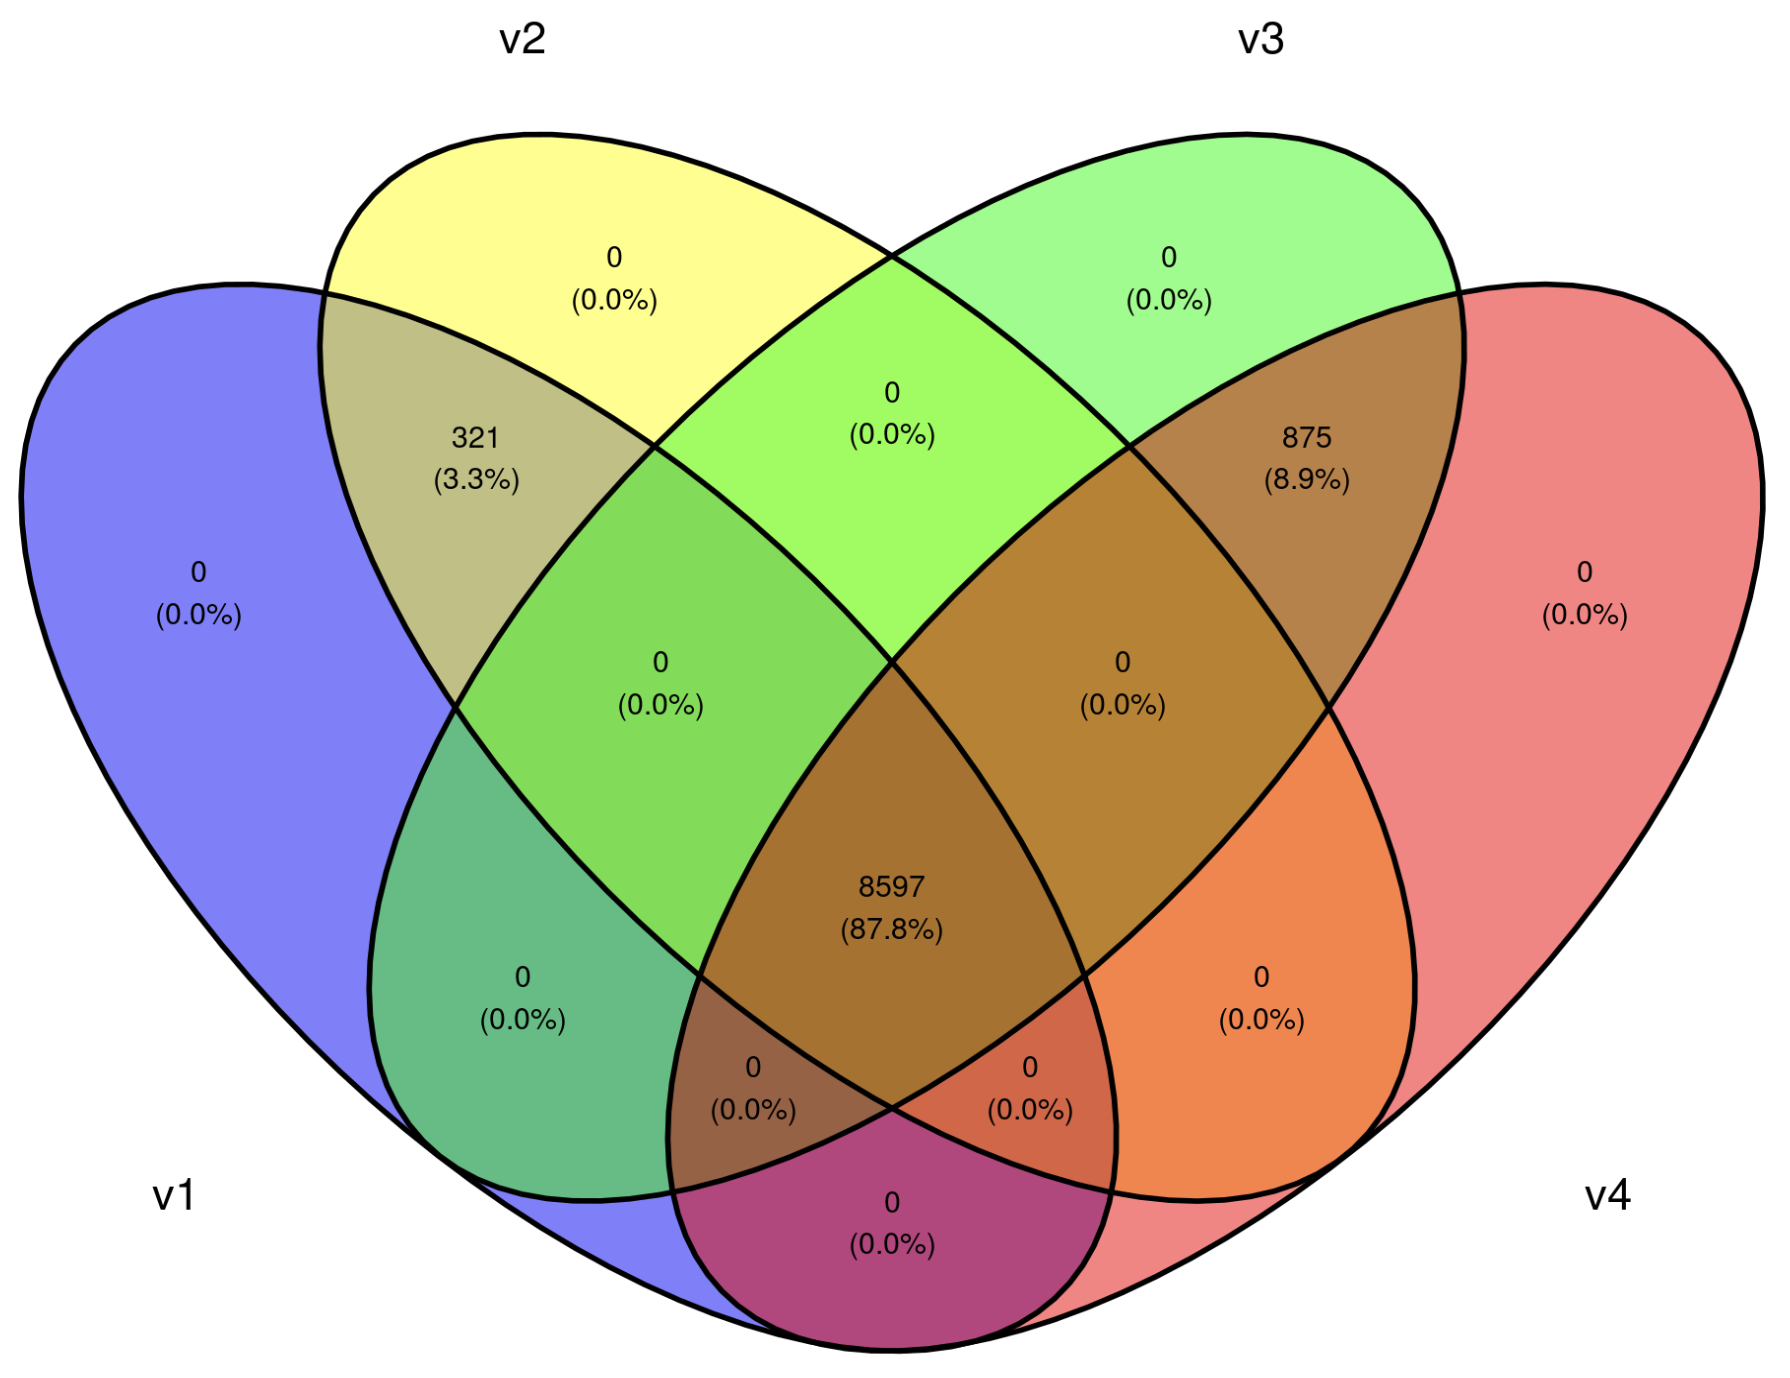
Cell IDs depend mainly on whether cellranger aggr is used: v1/v2 share their cells, while v3/v4 share theirs
Do cells found only in v1/v2 or v3/v4 visibly affect UMAP clustering?
#put all data frames into list
df_list <- list(df_v1, df_v2, df_v3, df_v4)

#merge all data frames together
df_merge <- Reduce(function(x, y) merge(x, y, all=TRUE), df_list)


df_merge[is.na(df_merge)] <- c("FilteredOut")

colnames(df_merge) <- c("cells","v1","v2","v3","v4")

df_merge <- df_merge[,-1]

library(ggsankey)
df_merge <- df_merge %>%
  make_long(v1,v2,v3,v4)


pl <- ggplot(df_merge, aes(x = x,
                     next_x = next_x,
                     node = node,
                     next_node = next_node,
                     fill = factor(node)))

pl <- pl +geom_sankey(flow.alpha = 0.5,          #This Creates the transparency of your node
                      node.color = "black",     # This is your node color
                      show.legend = TRUE)        # This determines if you want your legend to show

pl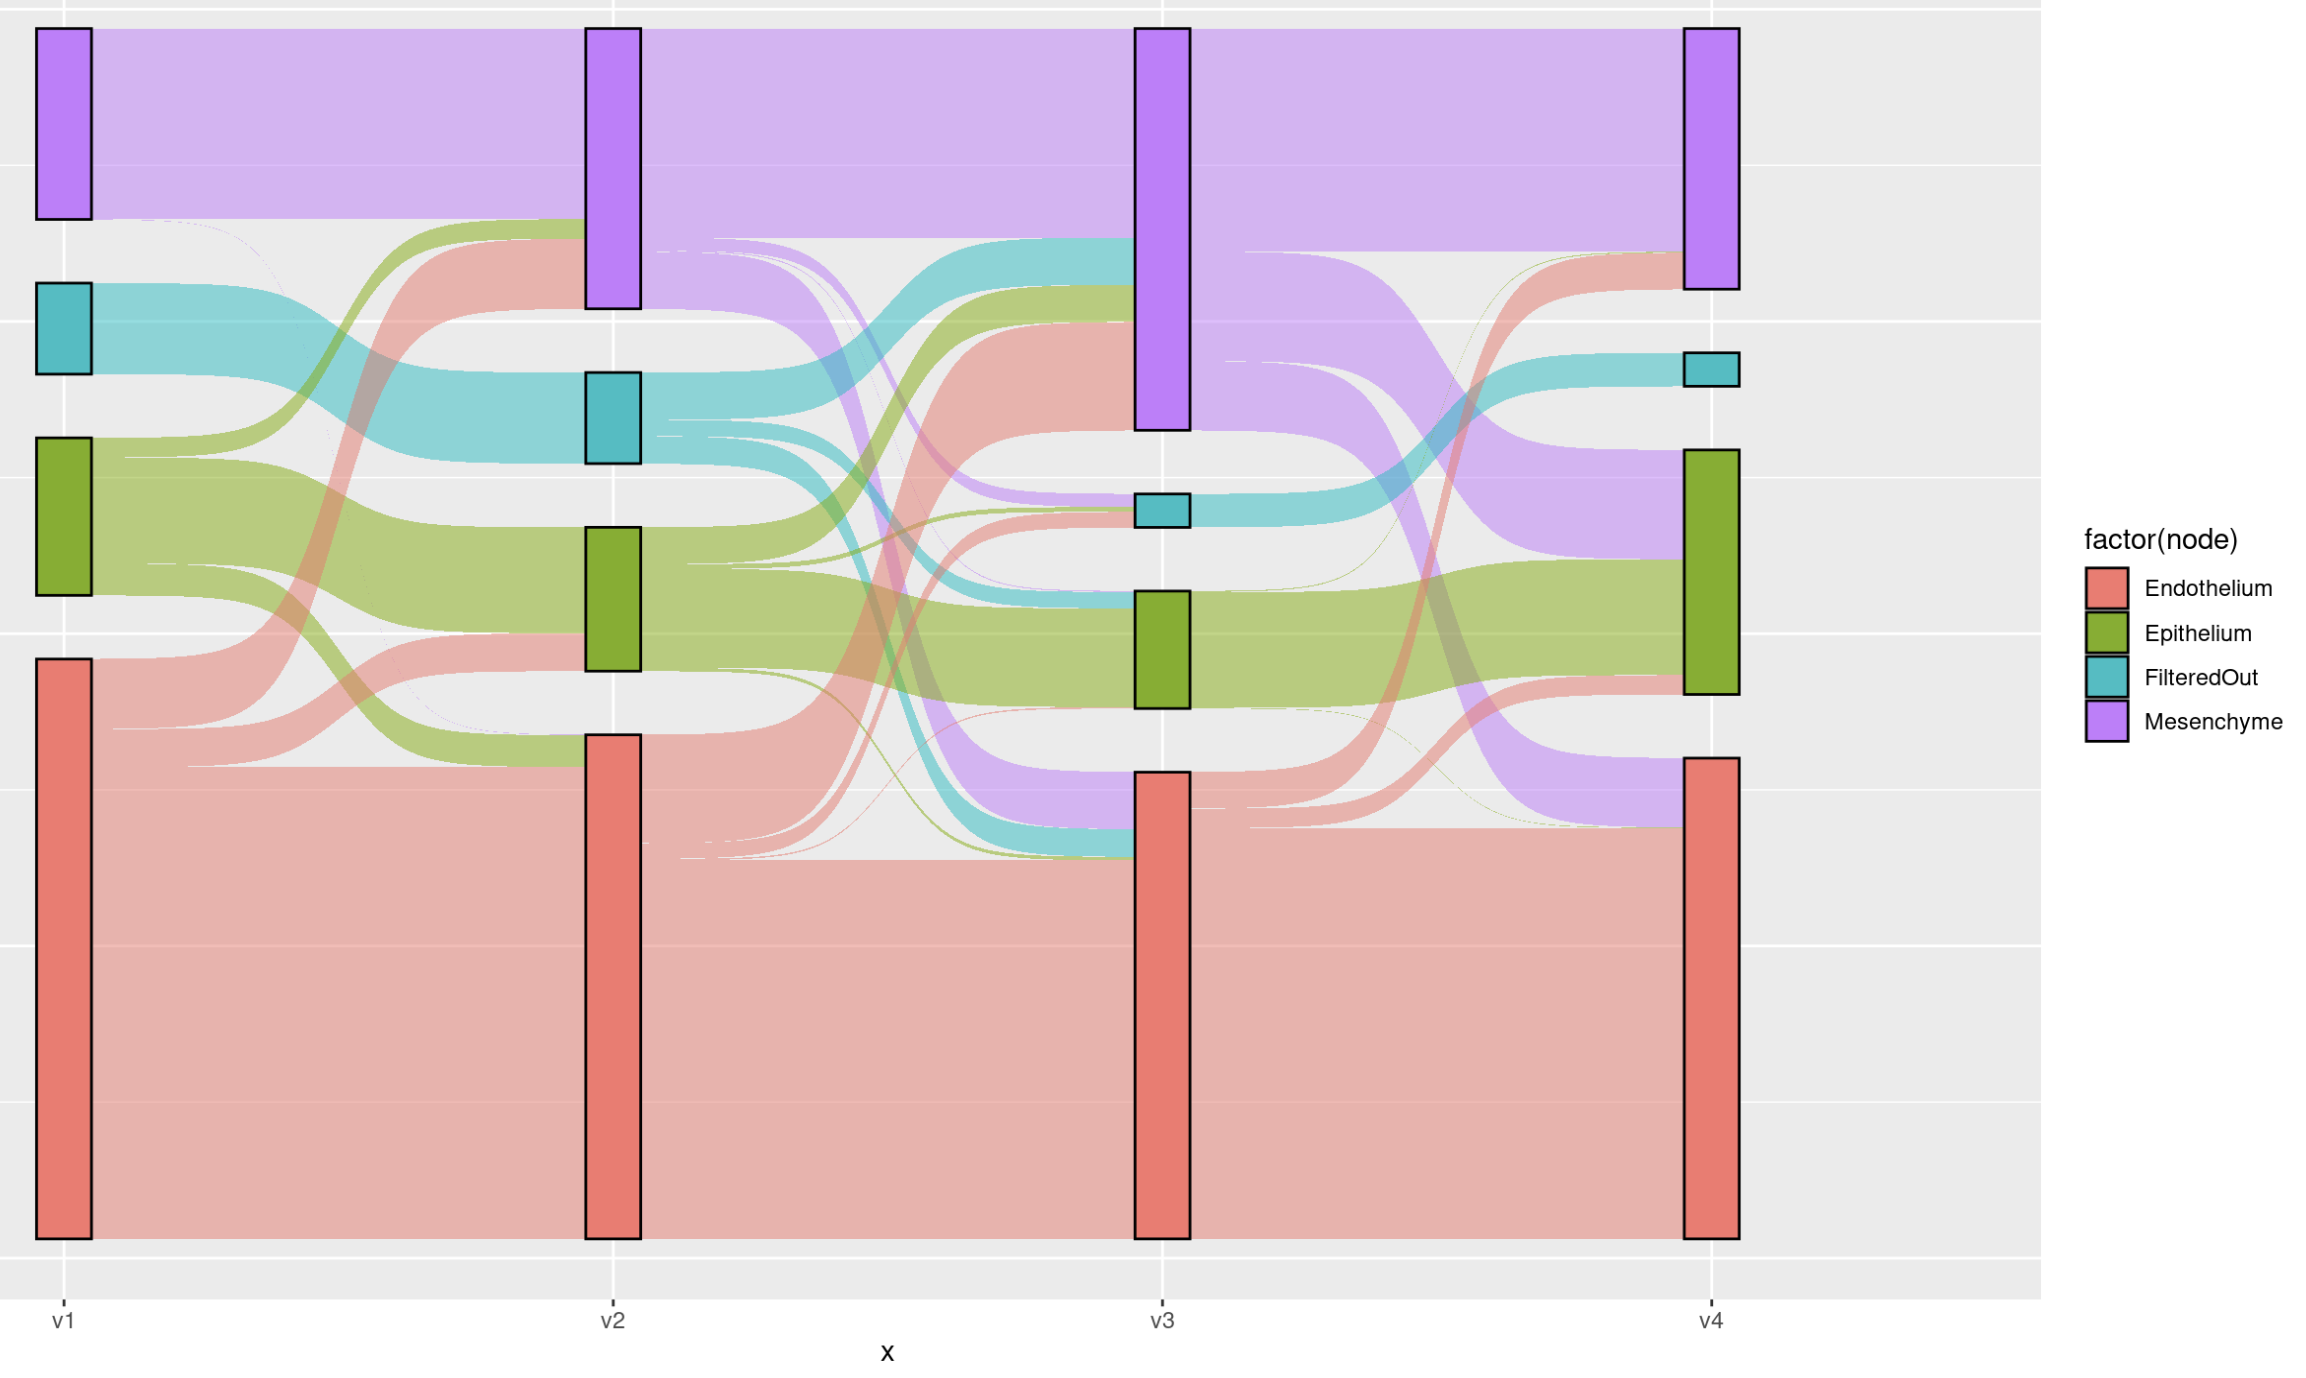
FilterOut indicates that the cell does not exist in that workflow.
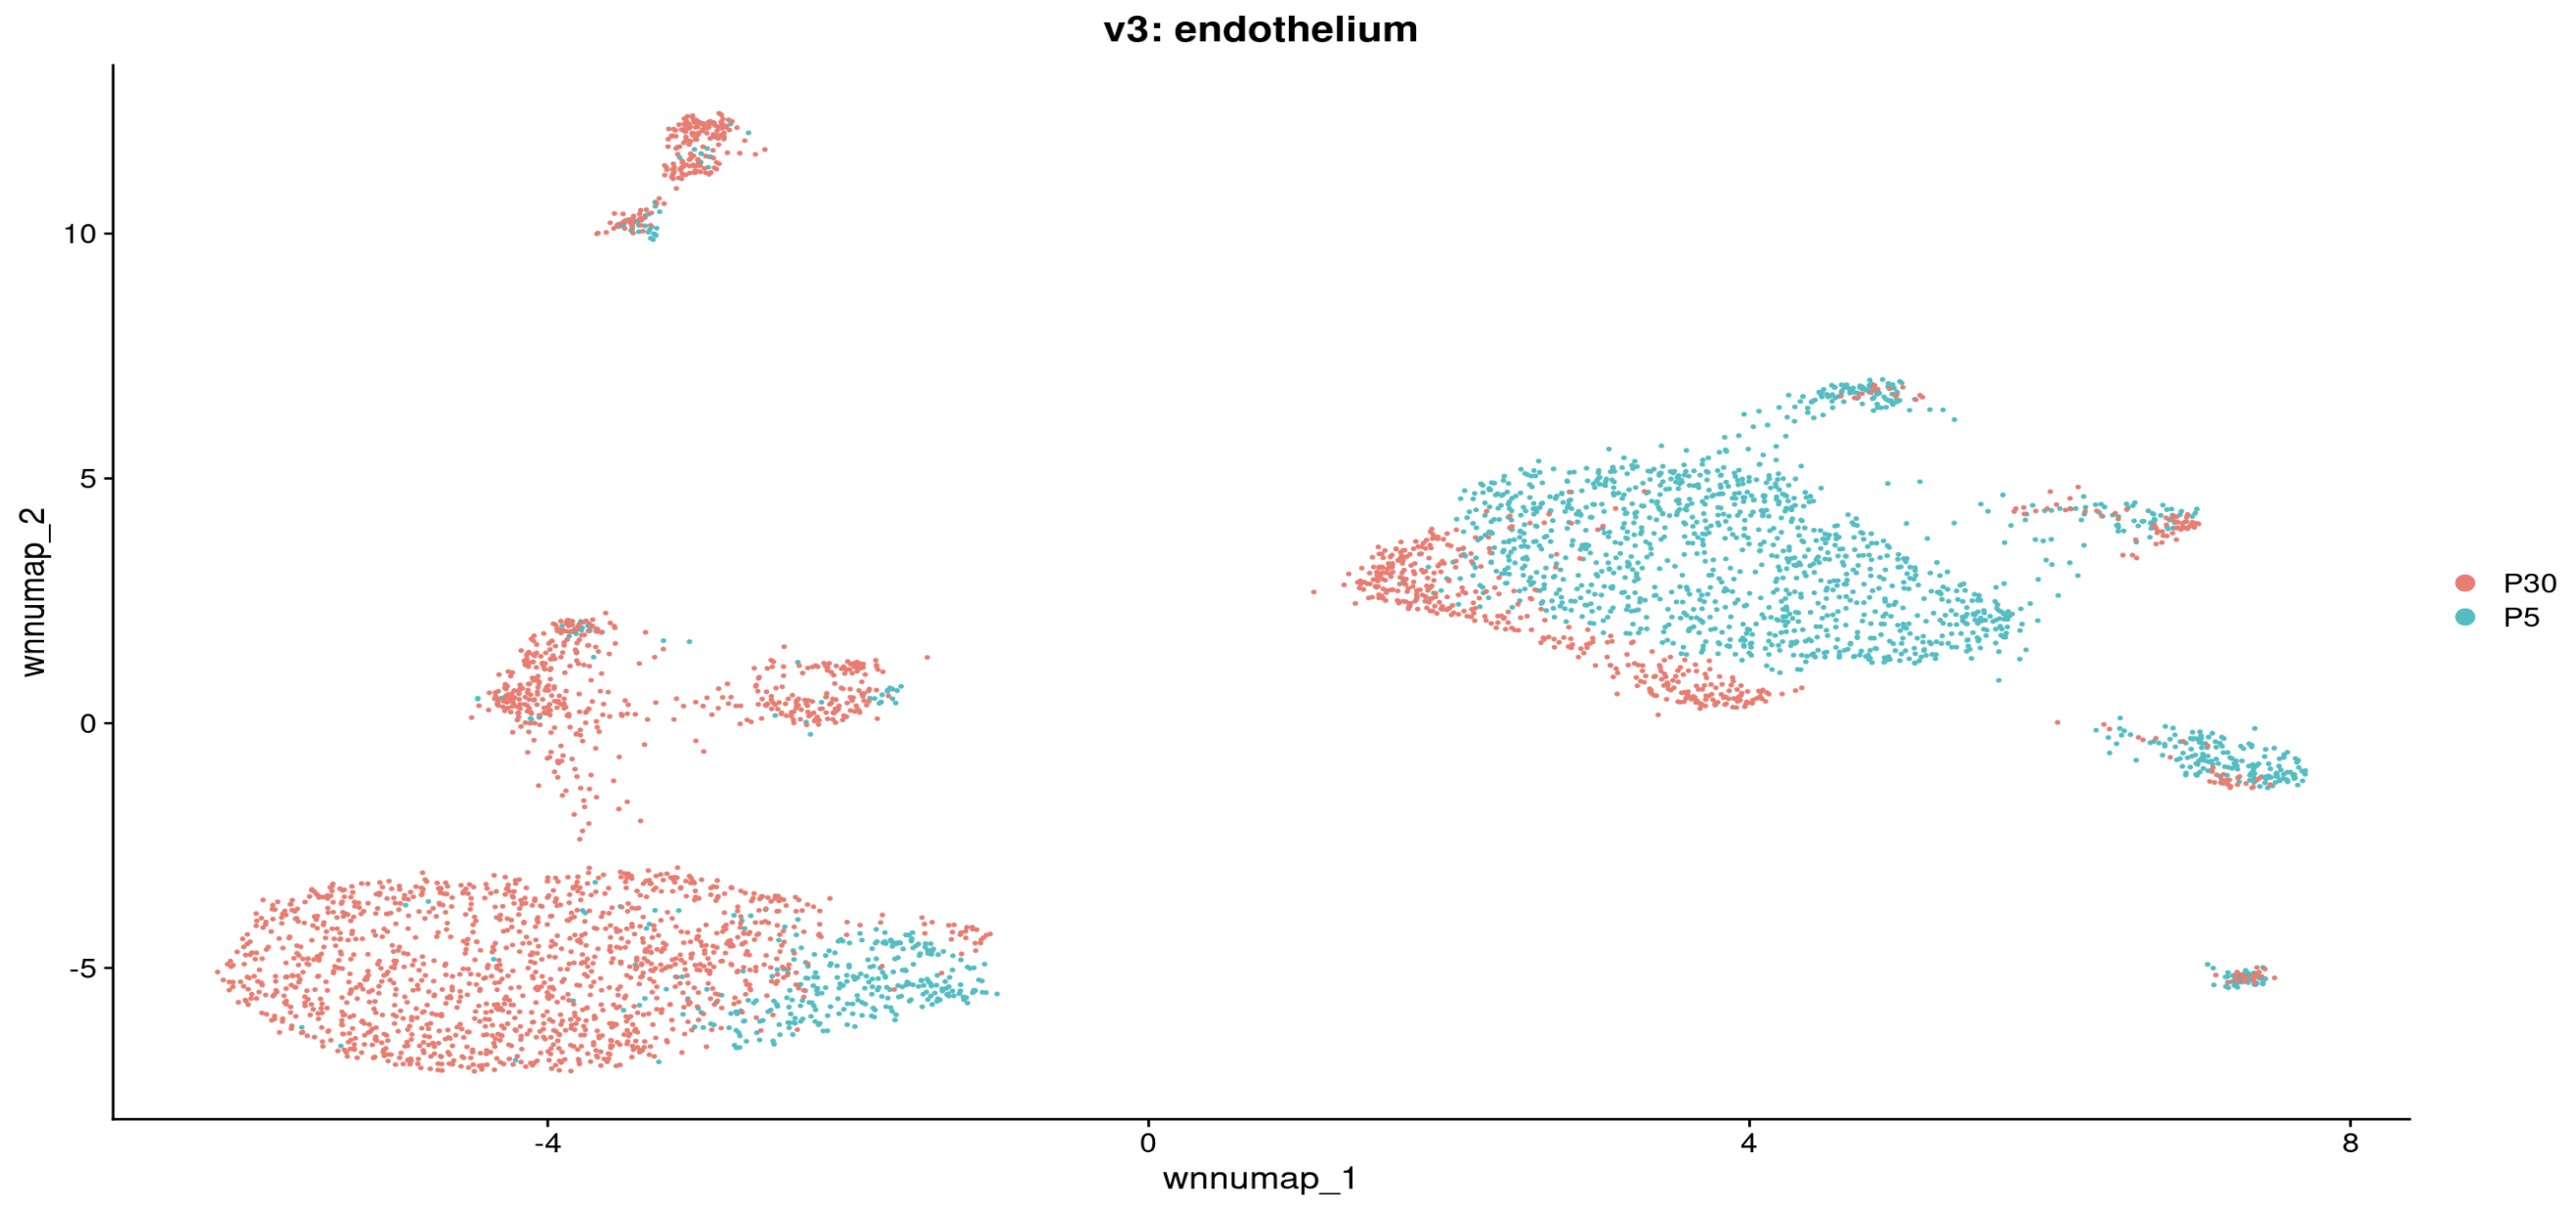
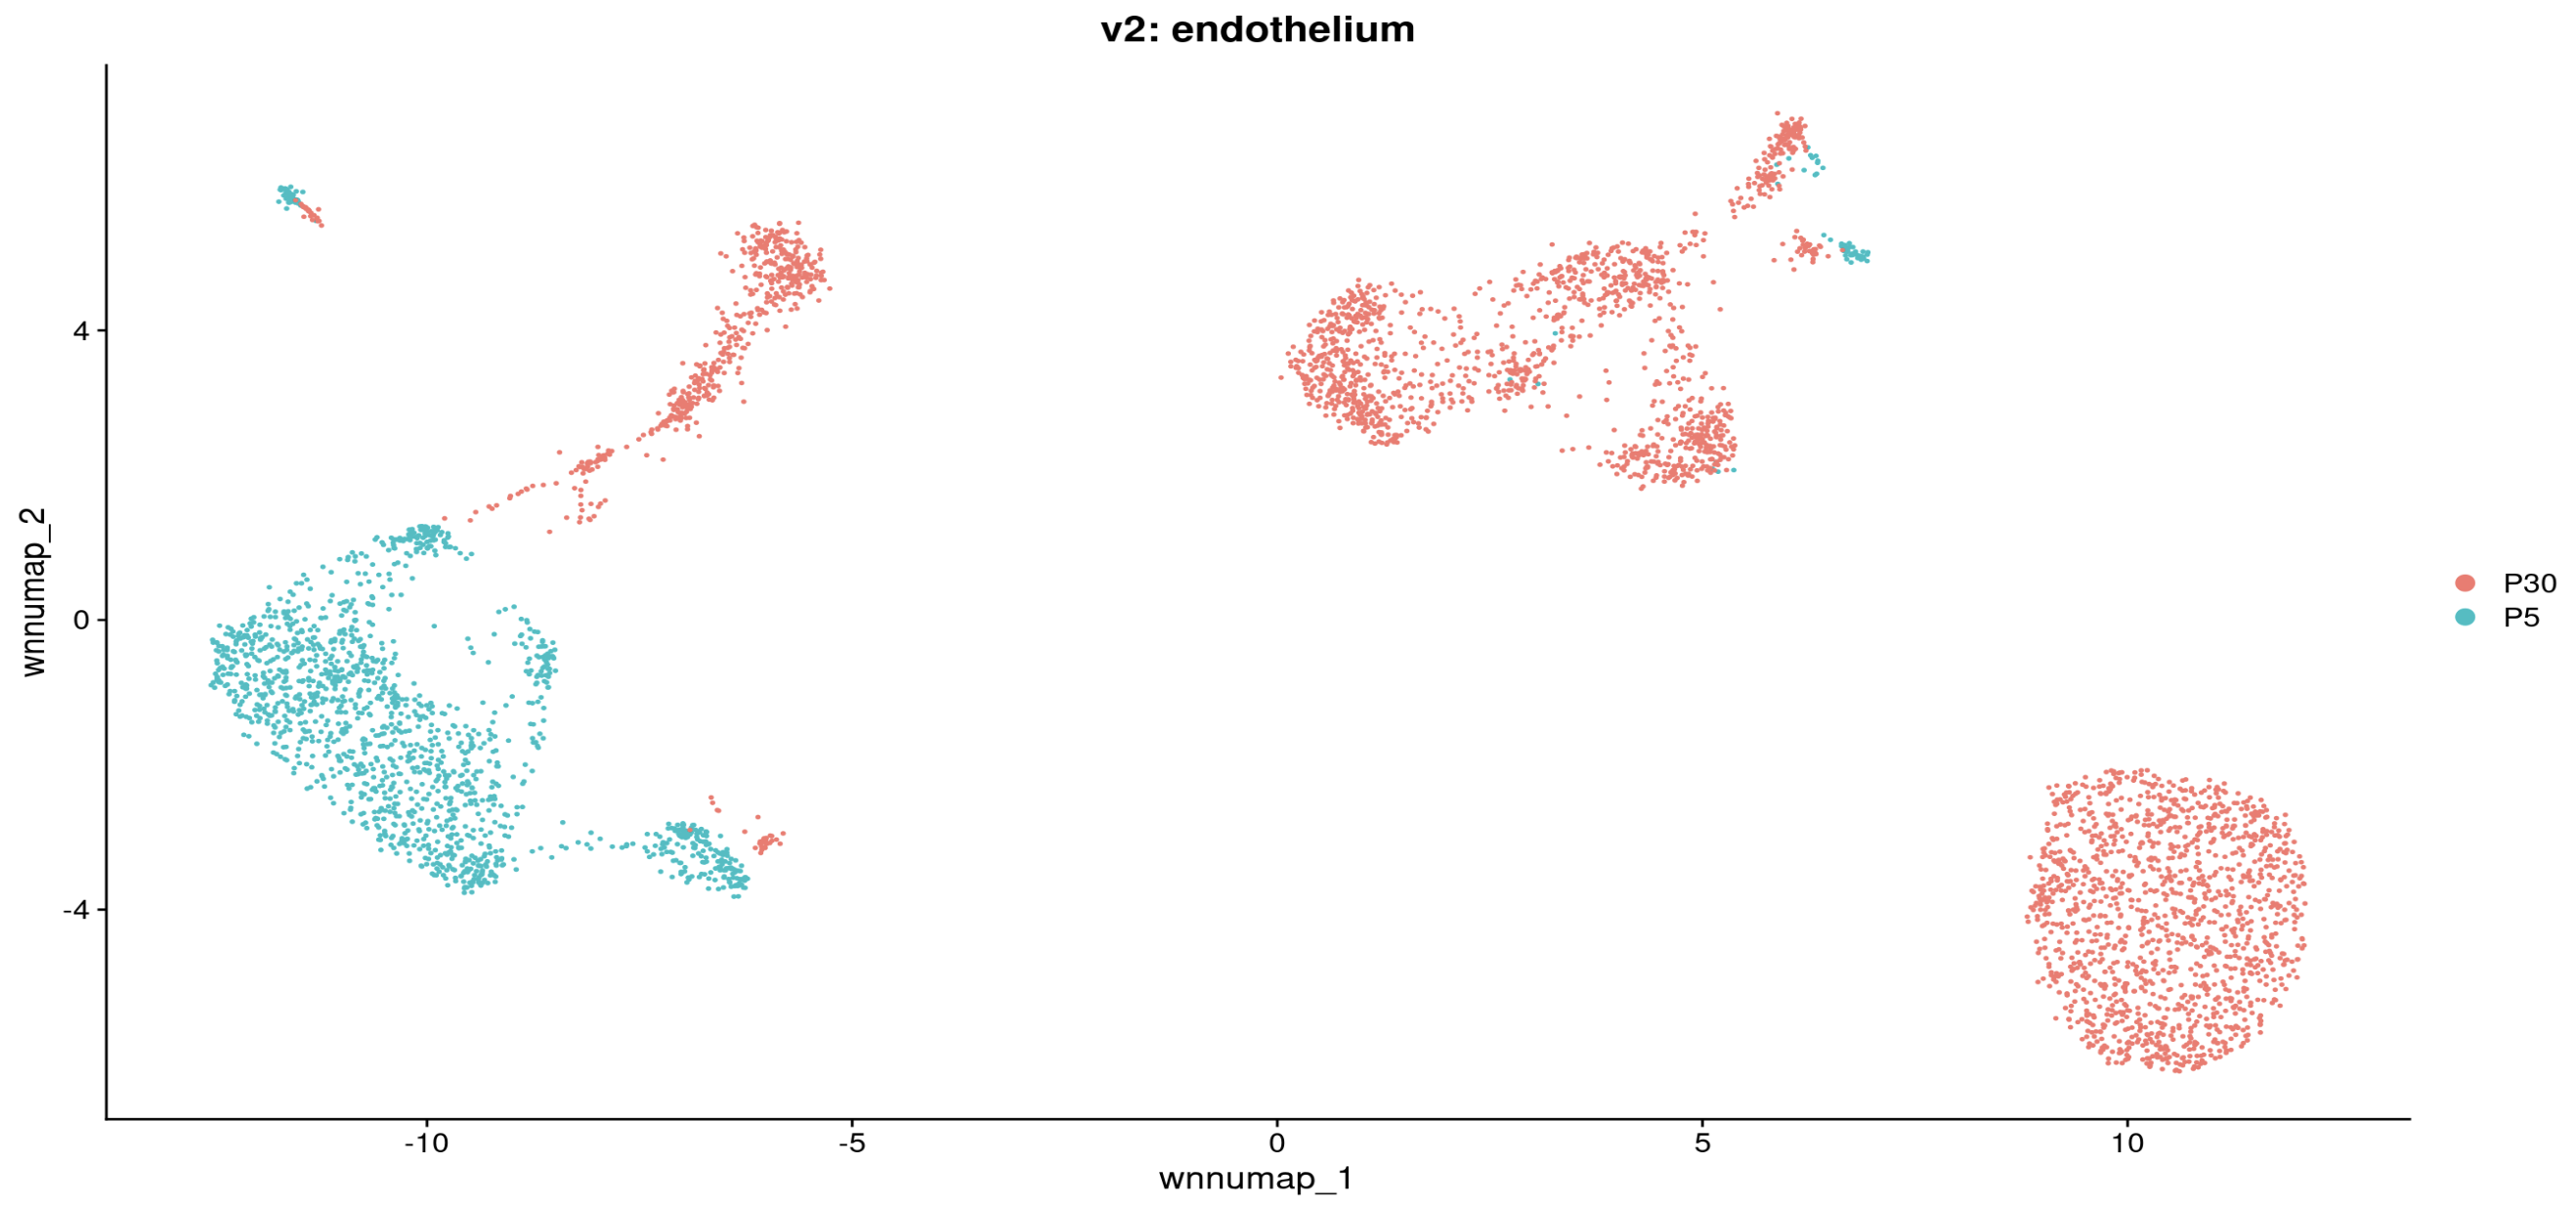
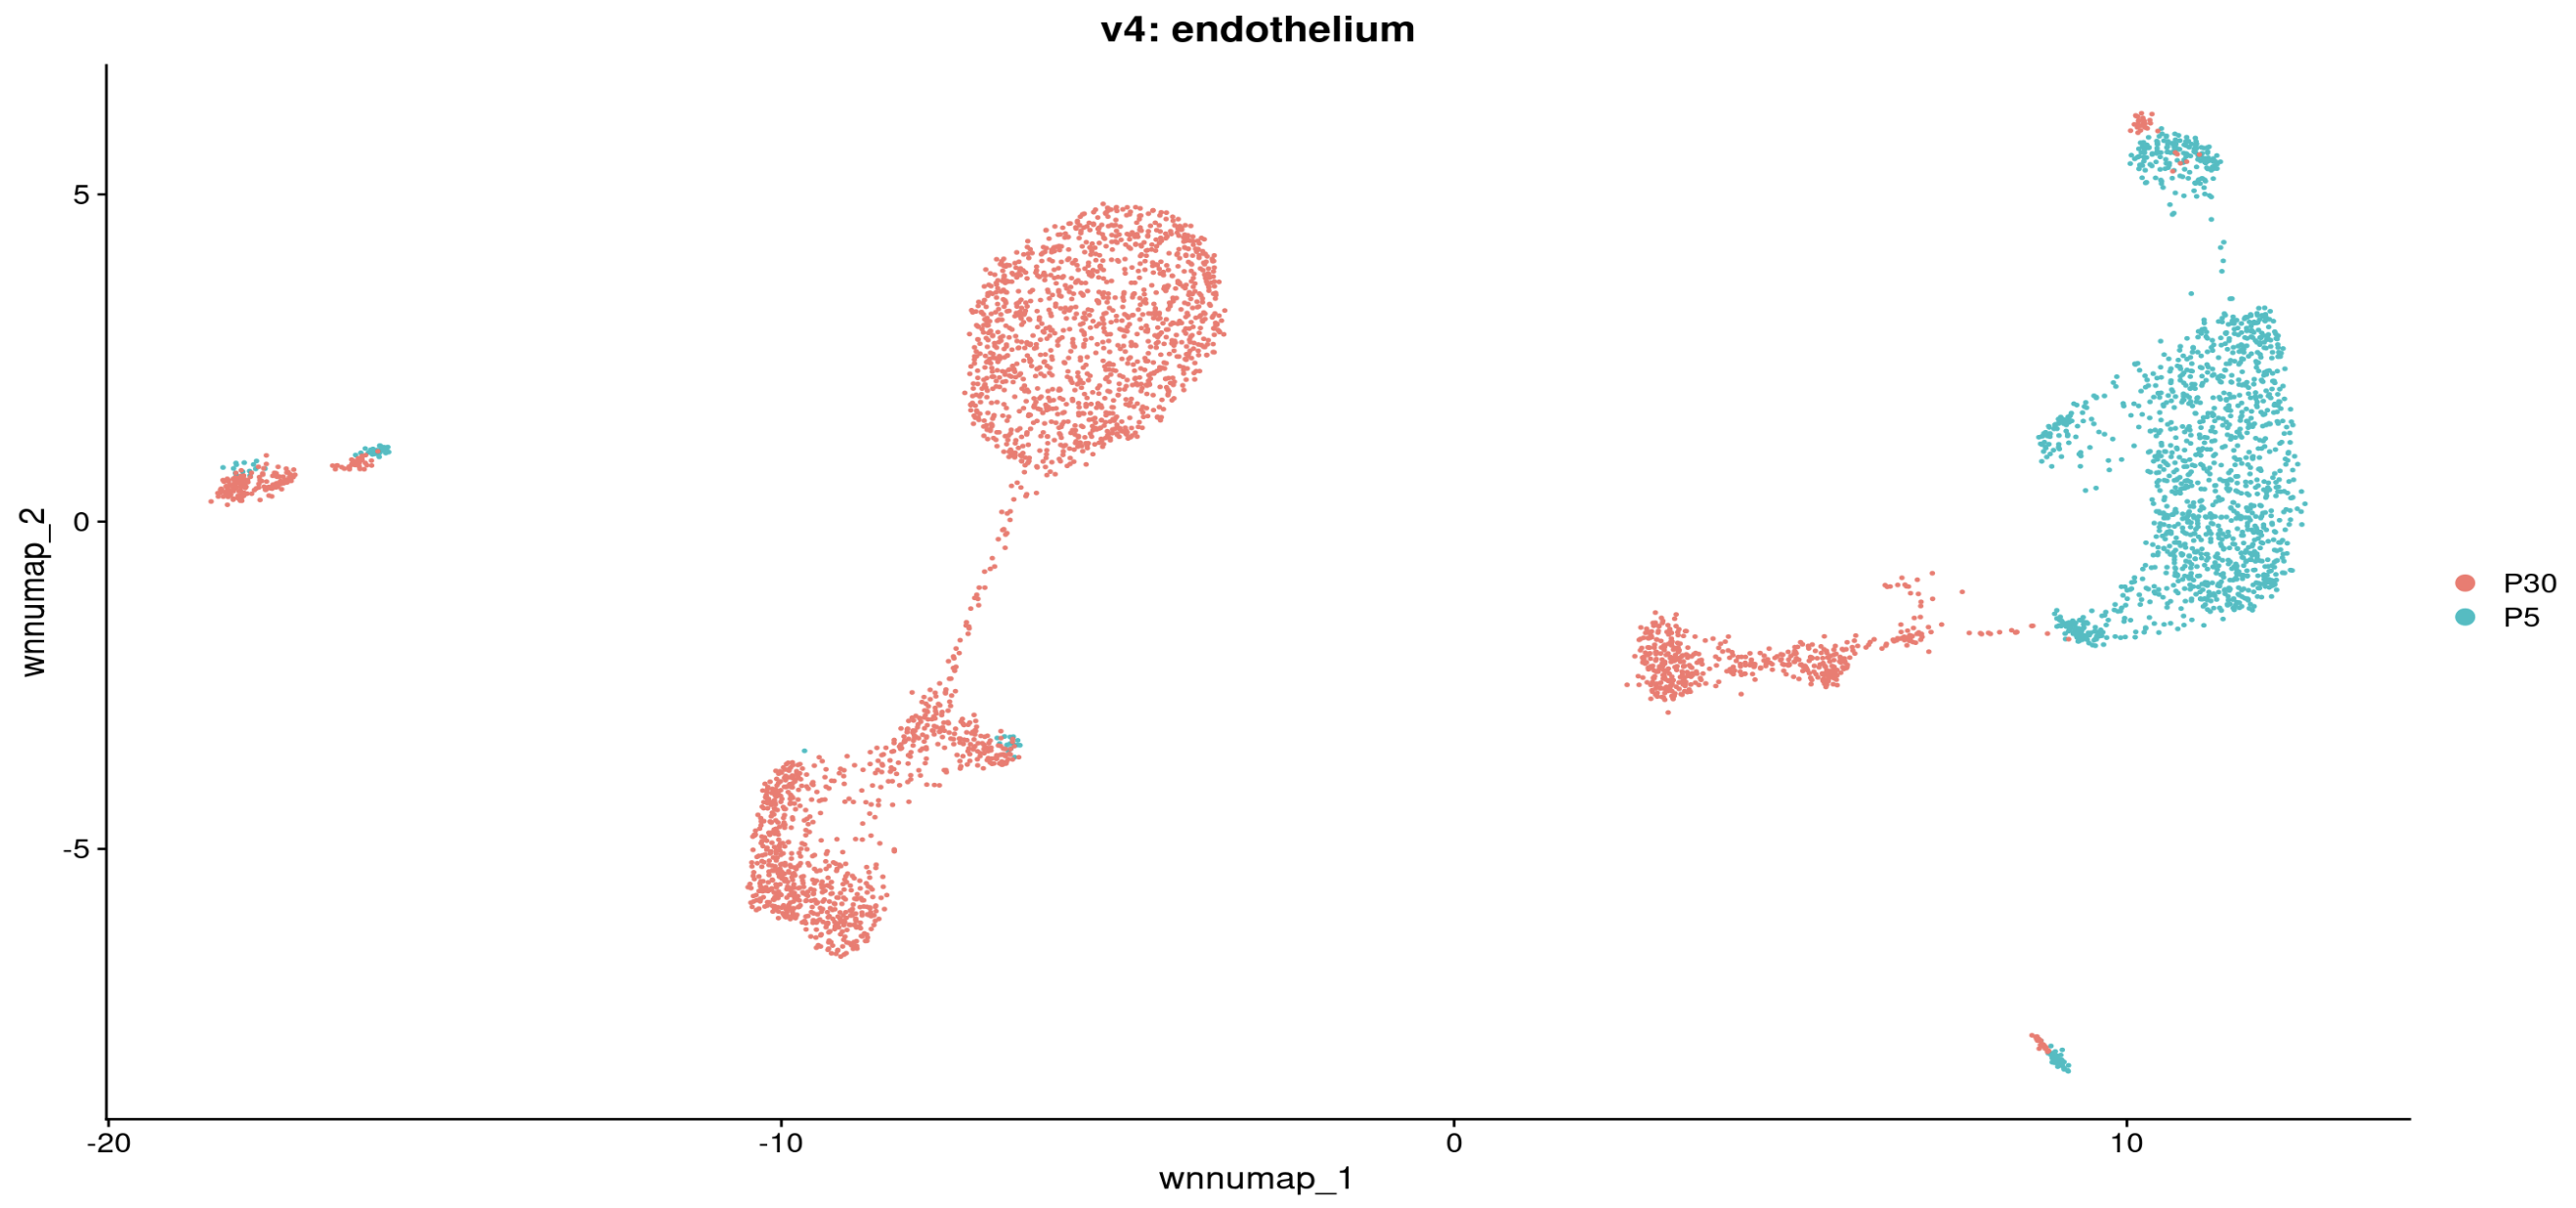
Subset endothelial cells and redraw UMAP to examine developmental changes across samples
integrated_multiome_v1_endo <- subset(integrated_multiome_v1,
                                           subset = celltype == "Endothelium")


integrated_multiome_v1_endo <- FindMultiModalNeighbors(integrated_multiome_v1_endo,
                                               reduction.list = list("integrated_pca",
                                                                     "integrated_lsi"),
                                               dims.list = list(1:50, 2:50),
                                               k.nn = 100)

integrated_multiome_v1_endo <- RunUMAP(integrated_multiome_v1_endo,
                                nn.name = "weighted.nn",
                                reduction.name = "wnn_umap",
                                return.model=TRUE)


########
integrated_multiome_v2_endo <- subset(integrated_multiome_v2,
                                           subset = celltype == "Endothelium")
integrated_multiome_v2_endo <- FindMultiModalNeighbors(integrated_multiome_v2_endo,
                                               reduction.list = list("SCT_pca",
                                                                     "lsi"),
                                               dims.list = list(1:50, 2:50),
                                               k.nn = 100)

integrated_multiome_v2_endo <- RunUMAP(integrated_multiome_v2_endo,
                                nn.name = "weighted.nn",
                                reduction.name = "wnn_umap",
                                return.model=TRUE)

#######
integrated_multiome_v3_endo <- subset(integrated_multiome_v3,
                                           subset = celltype == "Endothelium")


integrated_multiome_v3_endo <- FindMultiModalNeighbors(integrated_multiome_v3_endo,
                                               reduction.list = list("integrated_pca",
                                                                     "integrated_lsi"),
                                               dims.list = list(1:50, 2:50),
                                               k.nn = 100)

integrated_multiome_v3_endo <- RunUMAP(integrated_multiome_v3_endo,
                                nn.name = "weighted.nn",
                                reduction.name = "wnn_umap",
                                return.model=TRUE)


########
integrated_multiome_v4_endo <- subset(integrated_multiome_v4,
                                           subset = celltype == "Endothelium")
integrated_multiome_v4_endo <- FindMultiModalNeighbors(integrated_multiome_v4_endo,
                                               reduction.list = list("SCT_pca",
                                                                     "lsi"),
                                               dims.list = list(1:50, 2:50),
                                               k.nn = 100)

integrated_multiome_v4_endo <- RunUMAP(integrated_multiome_v4_endo,
                                nn.name = "weighted.nn",
                                reduction.name = "wnn_umap",
                                return.model=TRUE)


##########

DimPlot(integrated_multiome_v1_endo,
        reduction = "wnn_umap",
        label = TRUE,
        repel = TRUE,
        group.by = "sample") +
  ggtitle("v1: endothelium")

DimPlot(integrated_multiome_v2_endo,
        reduction = "wnn_umap",
        label = TRUE,
        repel = TRUE,
        group.by = "sample") +
  ggtitle("v2: endothelium")

DimPlot(integrated_multiome_v3_endo,
        reduction = "wnn_umap",
        label = TRUE,
        repel = TRUE,
        group.by = "sample") +
  ggtitle("v3: endothelium")

DimPlot(integrated_multiome_v4_endo,
        reduction = "wnn_umap",
        label = TRUE,
        repel = TRUE,
        group.by = "sample") +
  ggtitle("v4: endothelium")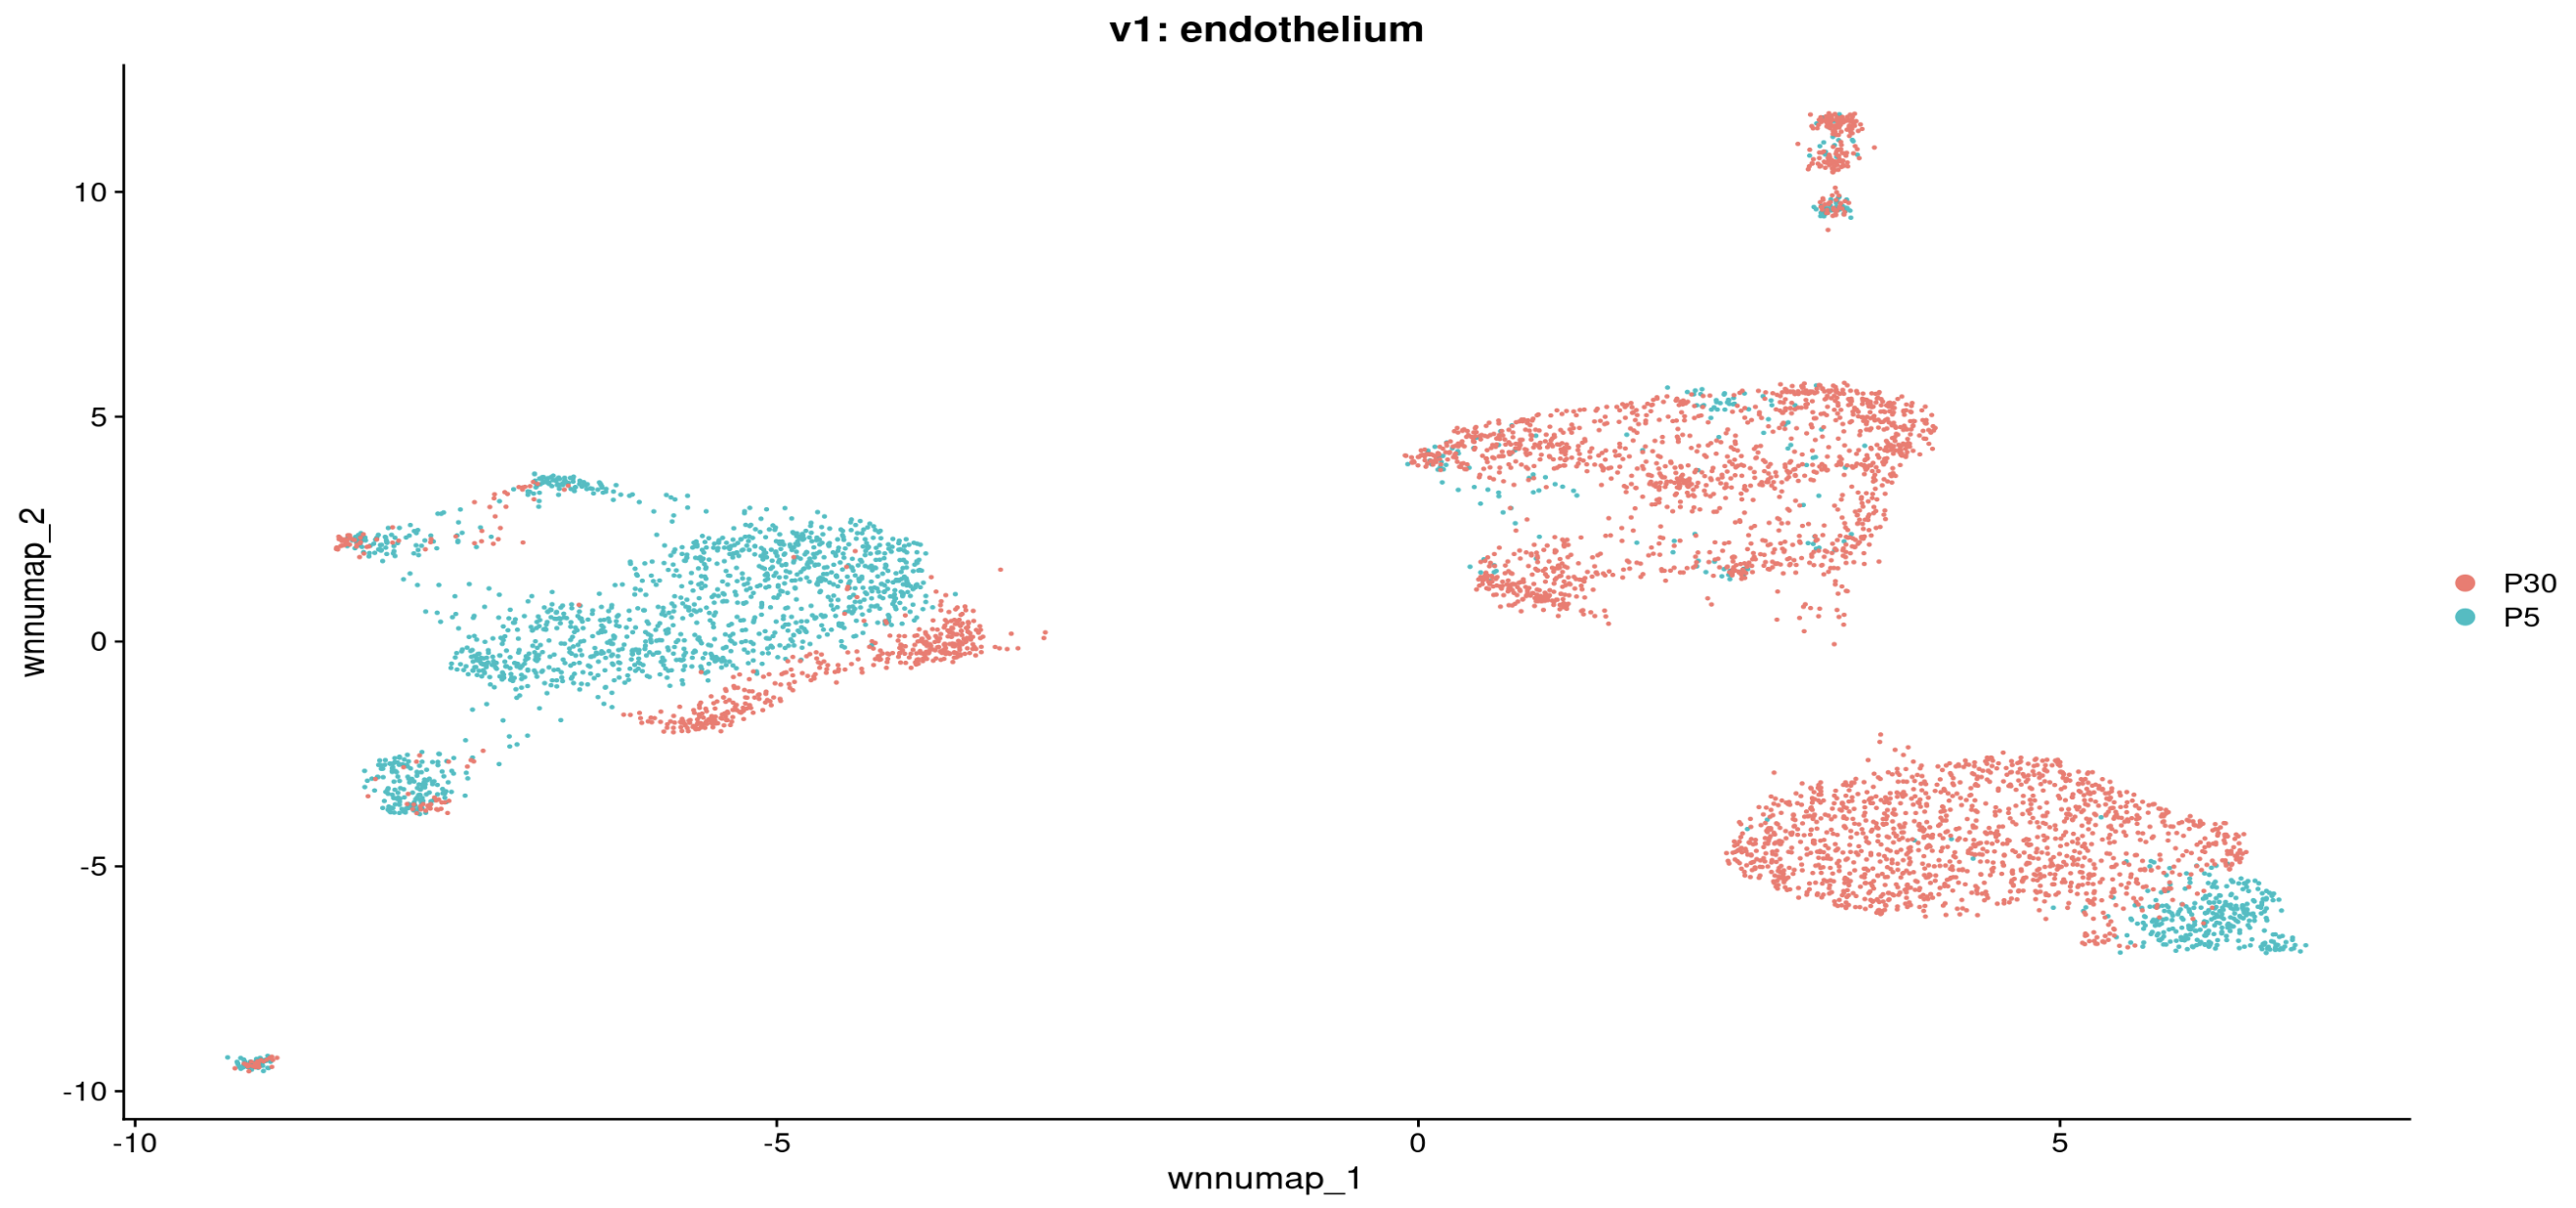
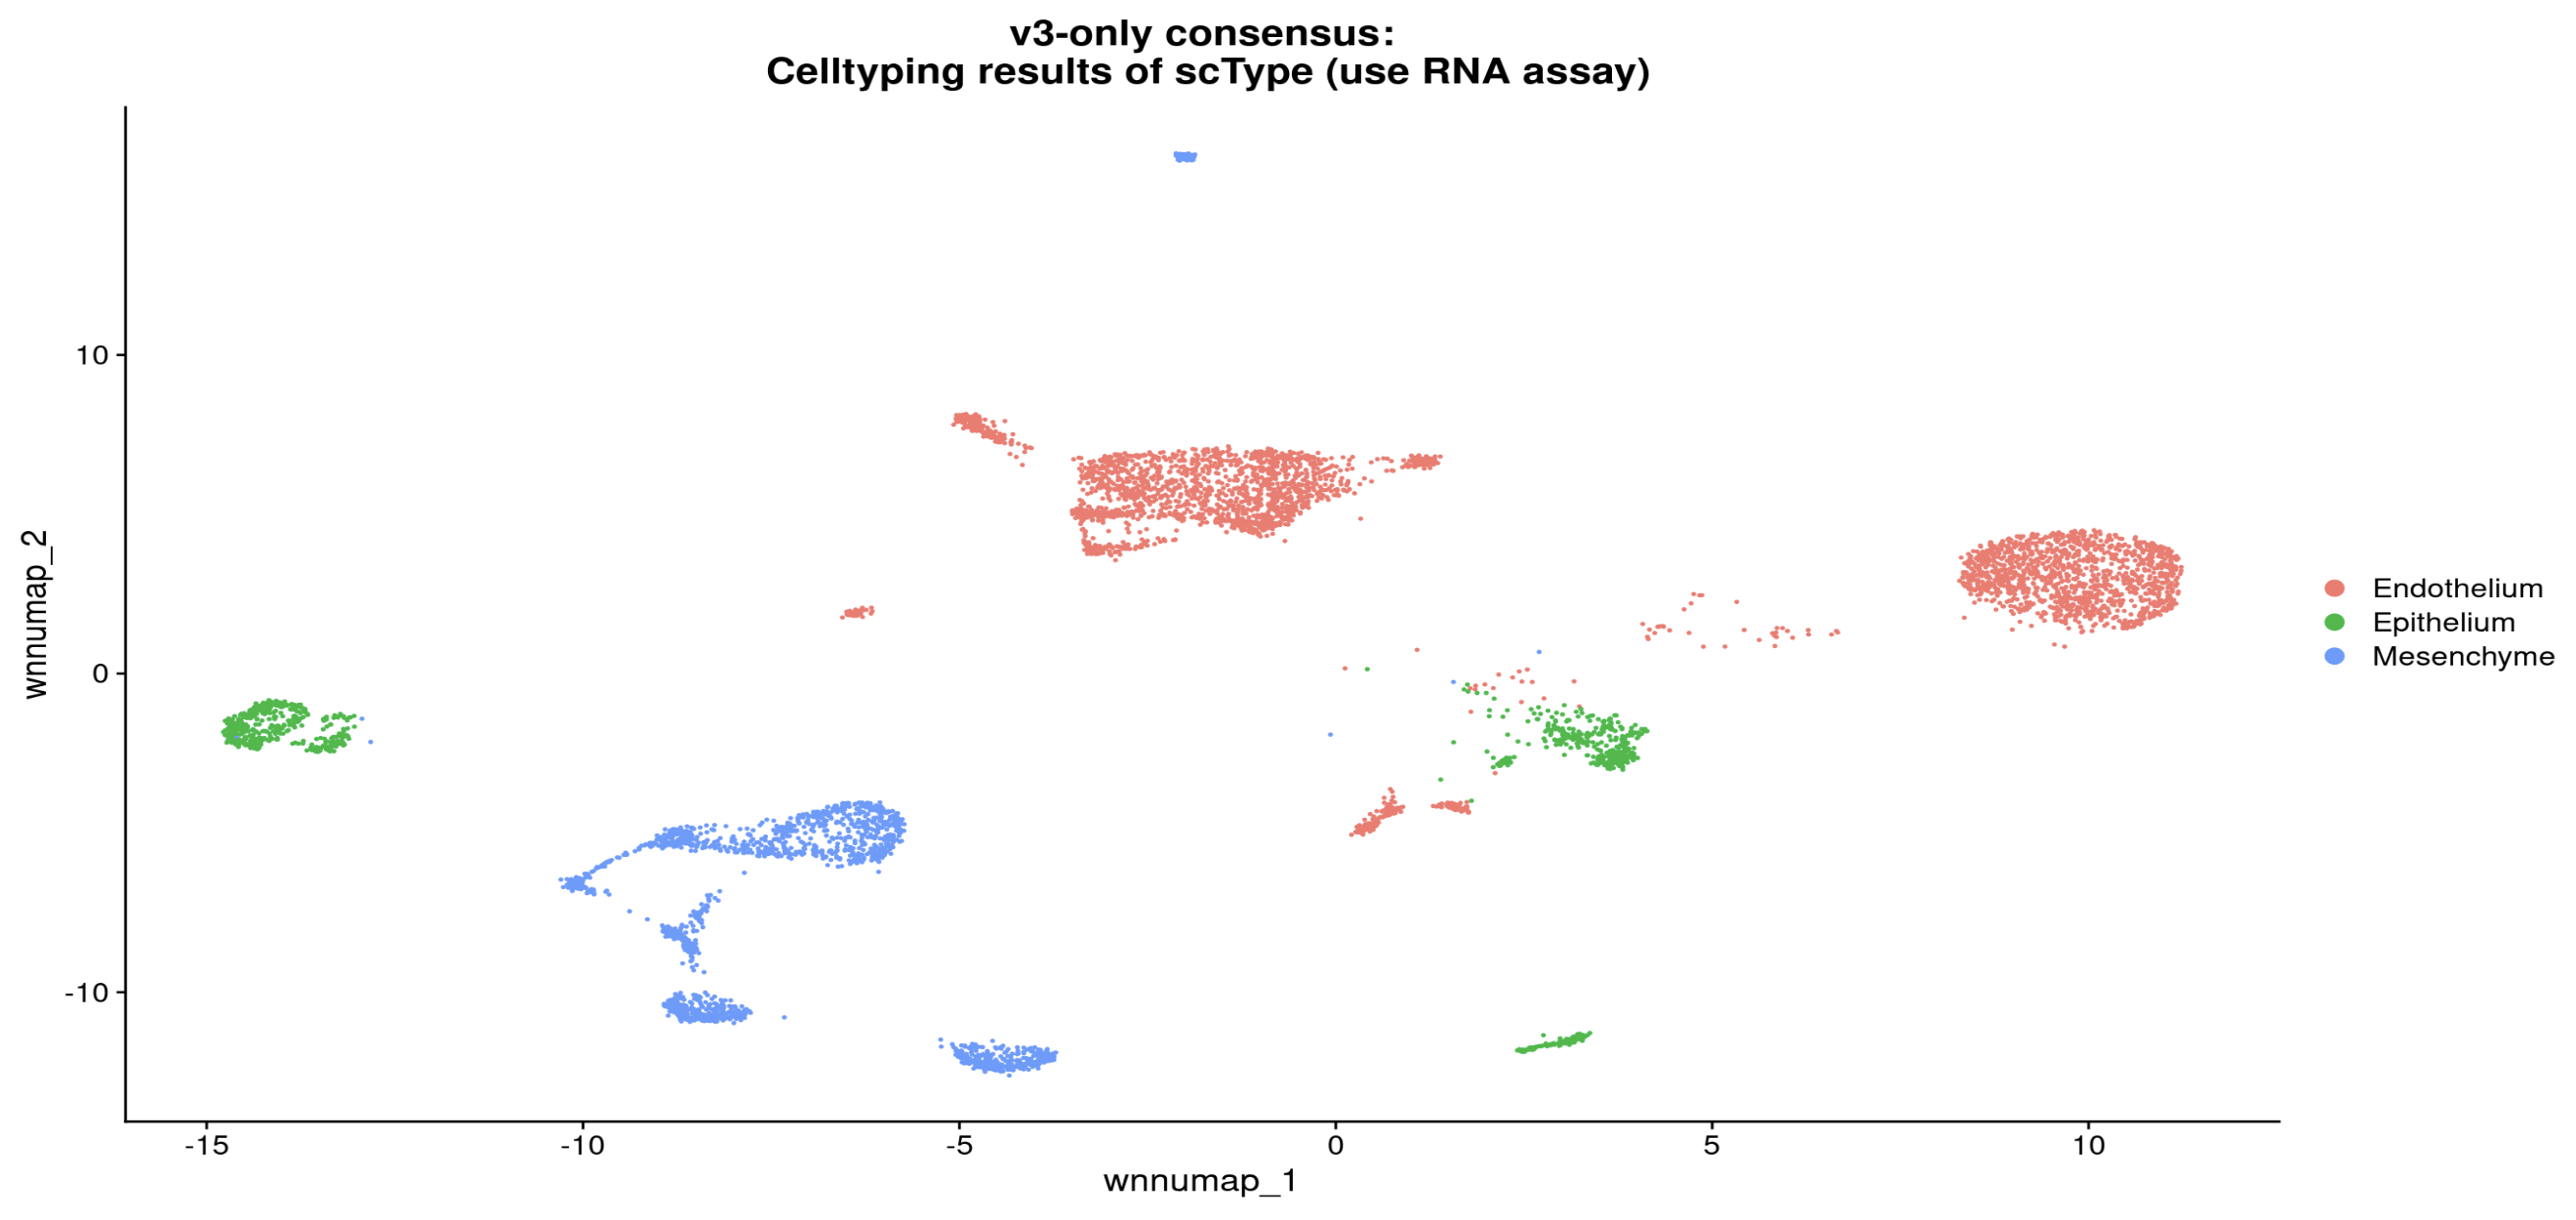
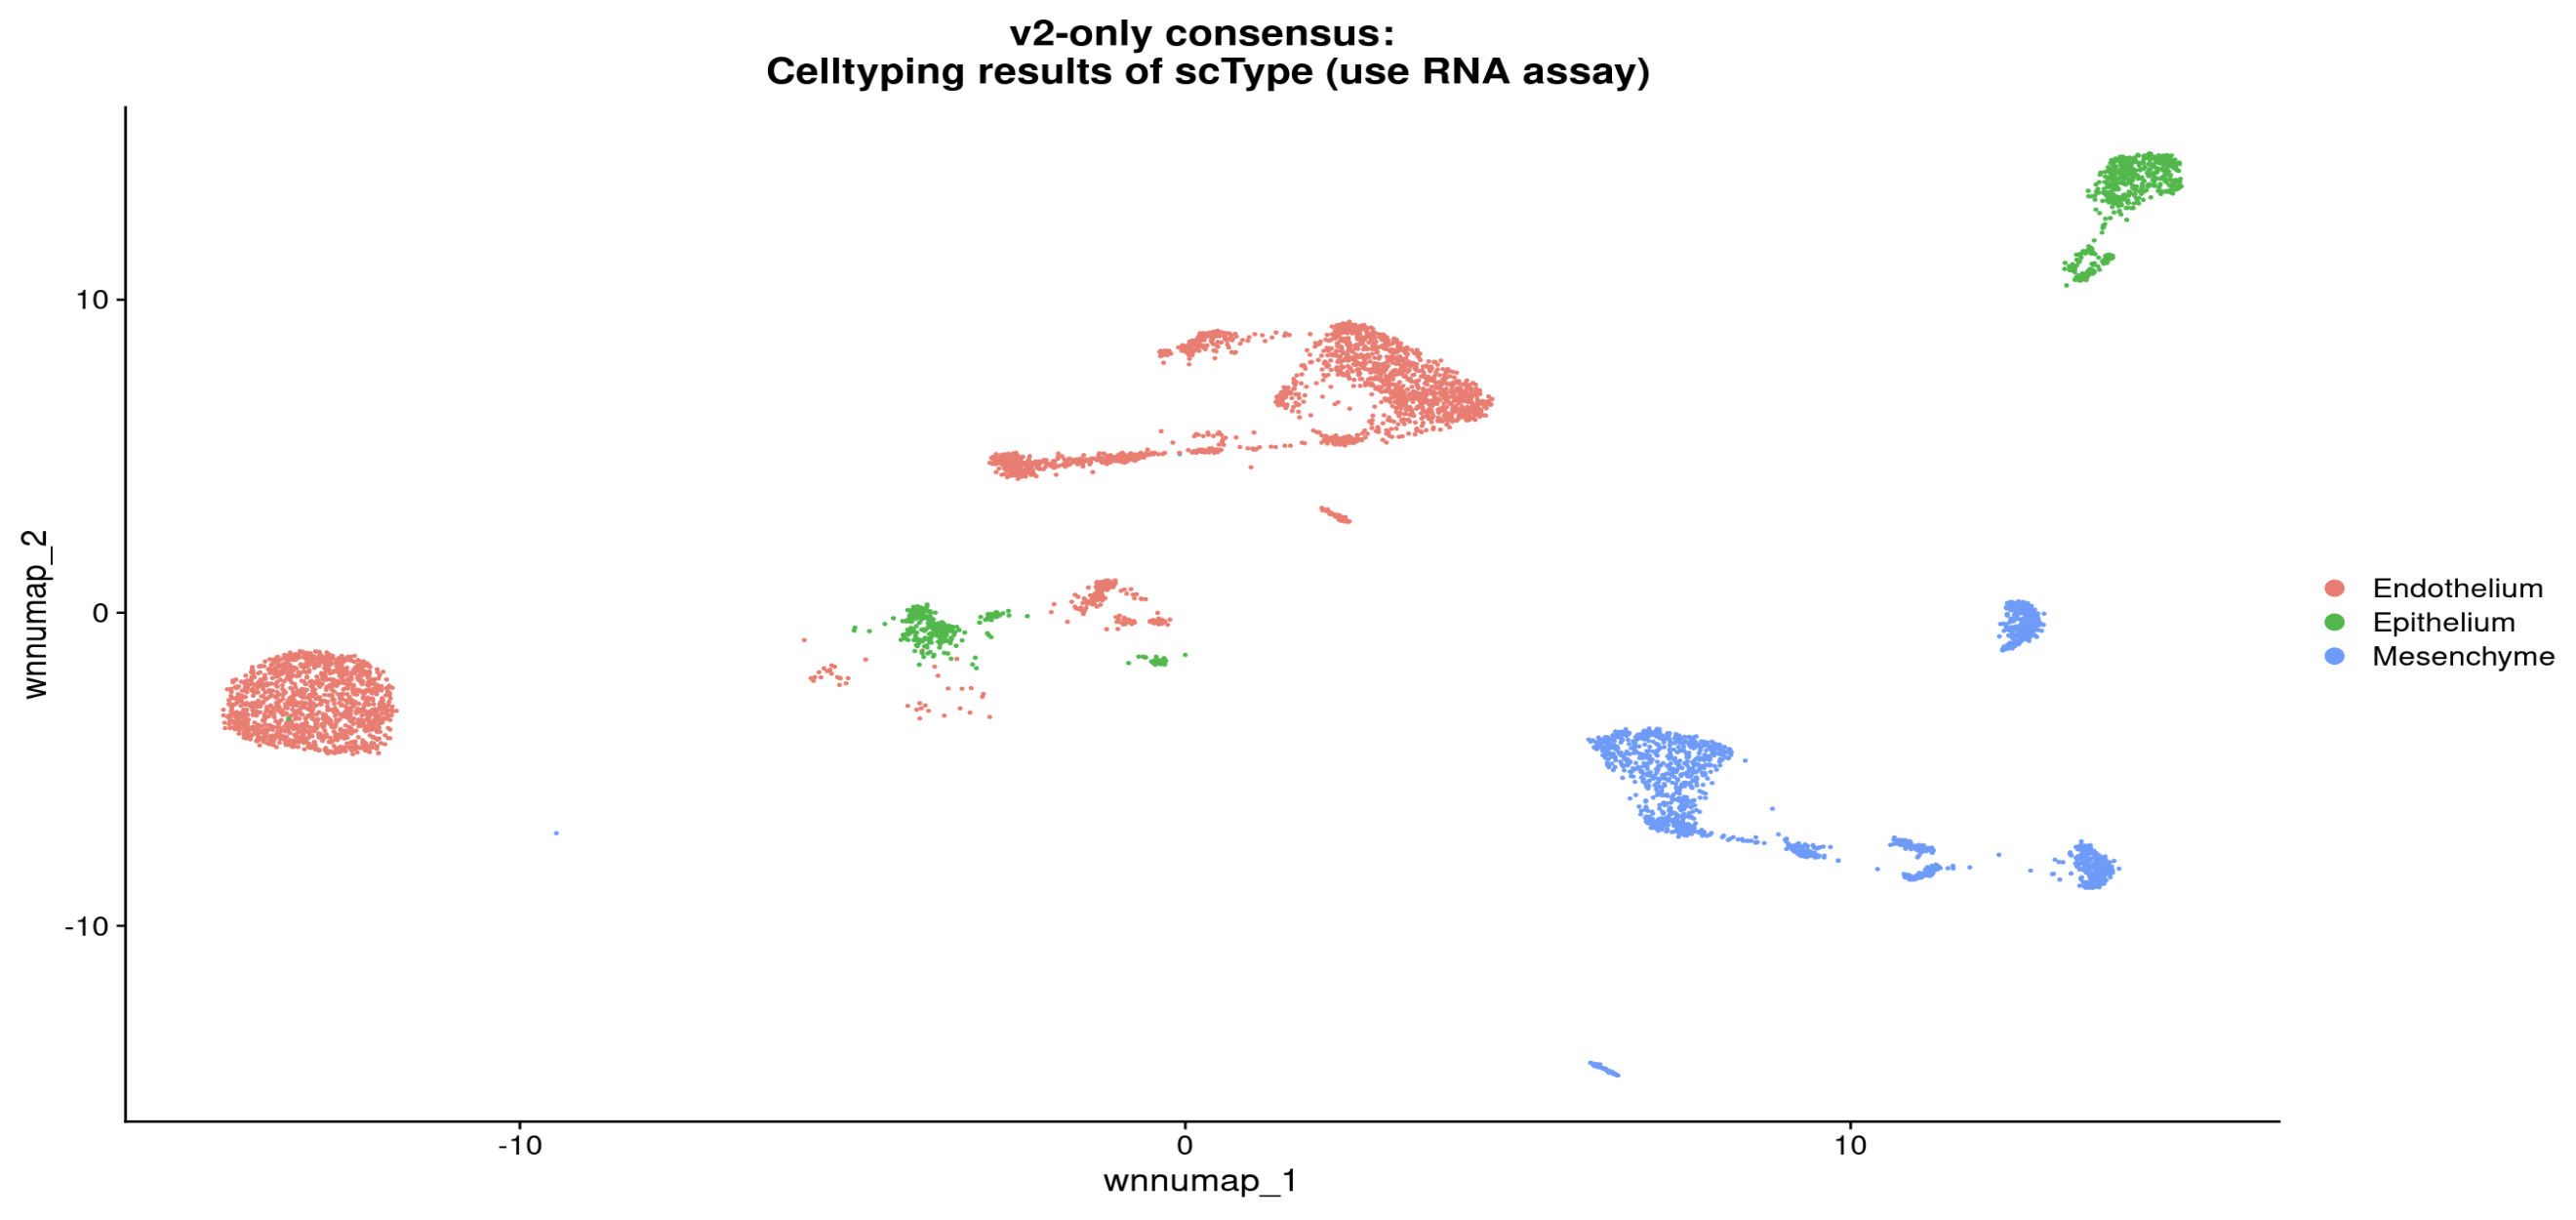
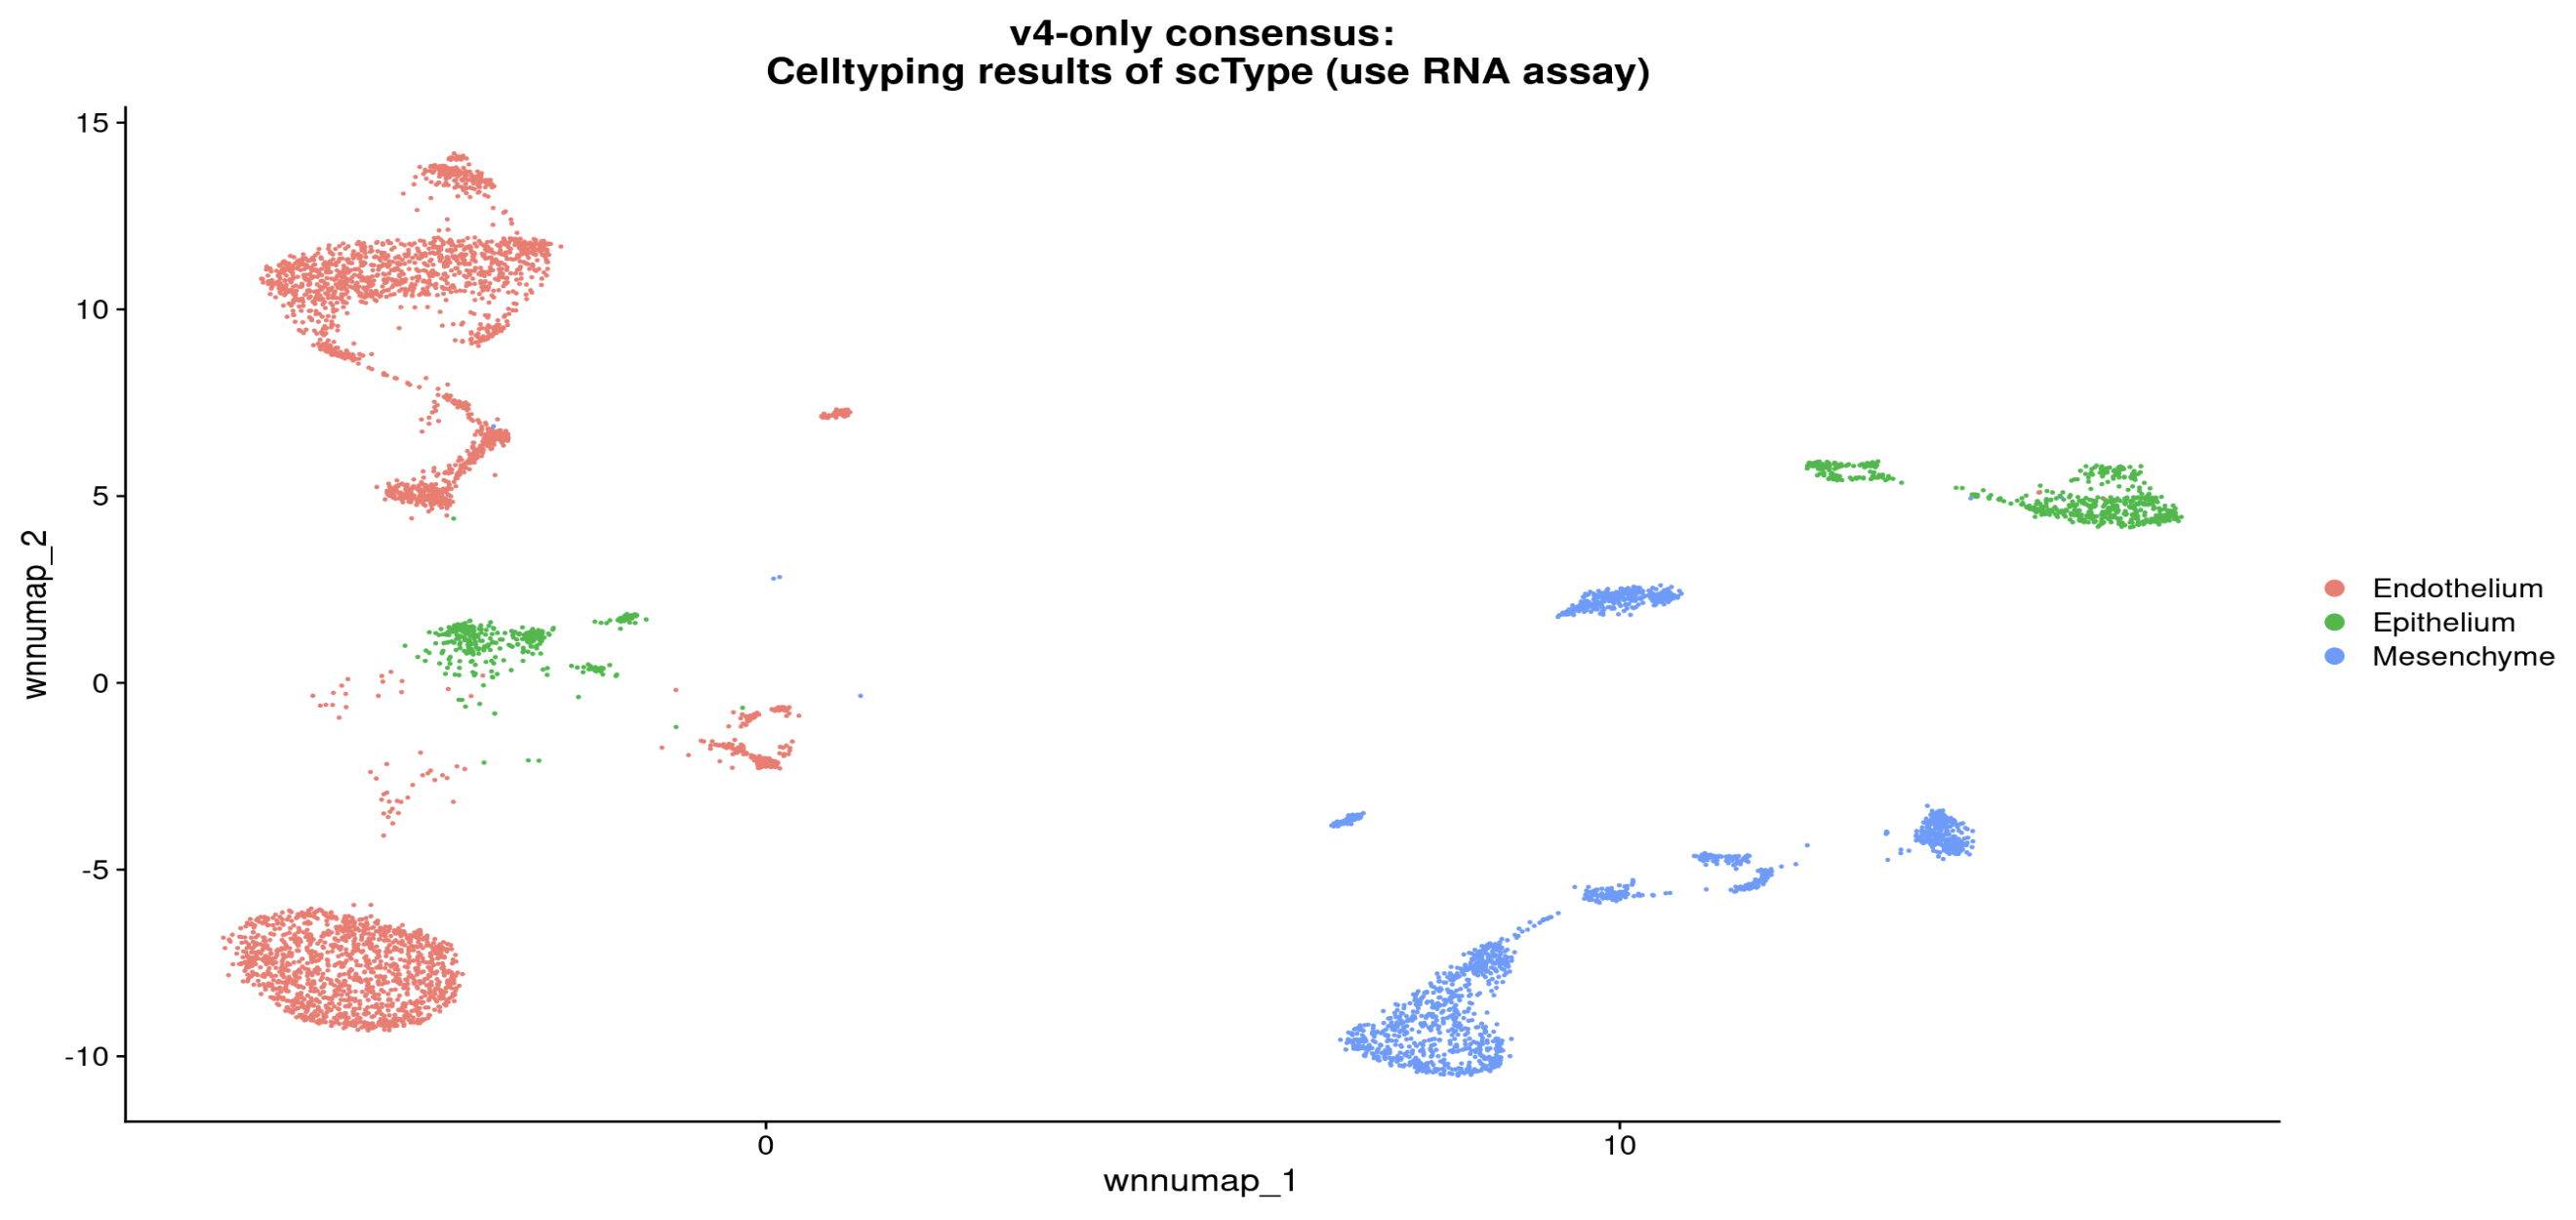
Retain consensus cells assigned to the same cell type in v1–v4, then display only those cells in each workflow’s UMAP
df_merge_noNA <- Reduce(function(x, y) merge(x, y, all=F), df_list)   # 8597


# 移除非 consensus 的細胞
uni <- df_merge_noNA[,-1] %>%
    rowwise() %>%
    do(data.frame(., Unique = n_distinct(unlist(.)))) %>% select(Unique)

df_merge_noNA$Unique <- uni$Unique
df_merge_noNA <- df_merge_noNA[df_merge_noNA$Unique == 1,] # 6141

Concensus_cell_ID <- df_merge_noNA$cells

integrated_multiome_v1_consensus <- subset(integrated_multiome_v1,
                                           subset = cells %in% Concensus_cell_ID)
integrated_multiome_v2_consensus <- subset(integrated_multiome_v2,
                                           subset = cells %in% Concensus_cell_ID)
integrated_multiome_v3_consensus <- subset(integrated_multiome_v3,
                                           subset = cells %in% Concensus_cell_ID)
integrated_multiome_v4_consensus <- subset(integrated_multiome_v4,
                                           subset = cells %in% Concensus_cell_ID)


DimPlot(integrated_multiome_v1_consensus,
        reduction = "wnn_umap",
        label = TRUE,
        repel = TRUE,
        group.by = "celltype") +
  ggtitle("v1-only consensus:\n Celltyping results of scType (use RNA assay)")


DimPlot(integrated_multiome_v2_consensus,
        reduction = "wnn_umap",
        label = TRUE,
        repel = TRUE,
        group.by = "celltype") +
  ggtitle("v2-only consensus:\n Celltyping results of scType (use RNA assay)")


DimPlot(integrated_multiome_v3_consensus,
        reduction = "wnn_umap",
        label = TRUE,
        repel = TRUE,
        group.by = "celltype") +
  ggtitle("v3-only consensus:\n Celltyping results of scType (use RNA assay)")


DimPlot(integrated_multiome_v4_consensus,
        reduction = "wnn_umap",
        label = TRUE,
        repel = TRUE,
        group.by = "celltype") +
  ggtitle("v4-only consensus:\n Celltyping results of scType (use RNA assay)")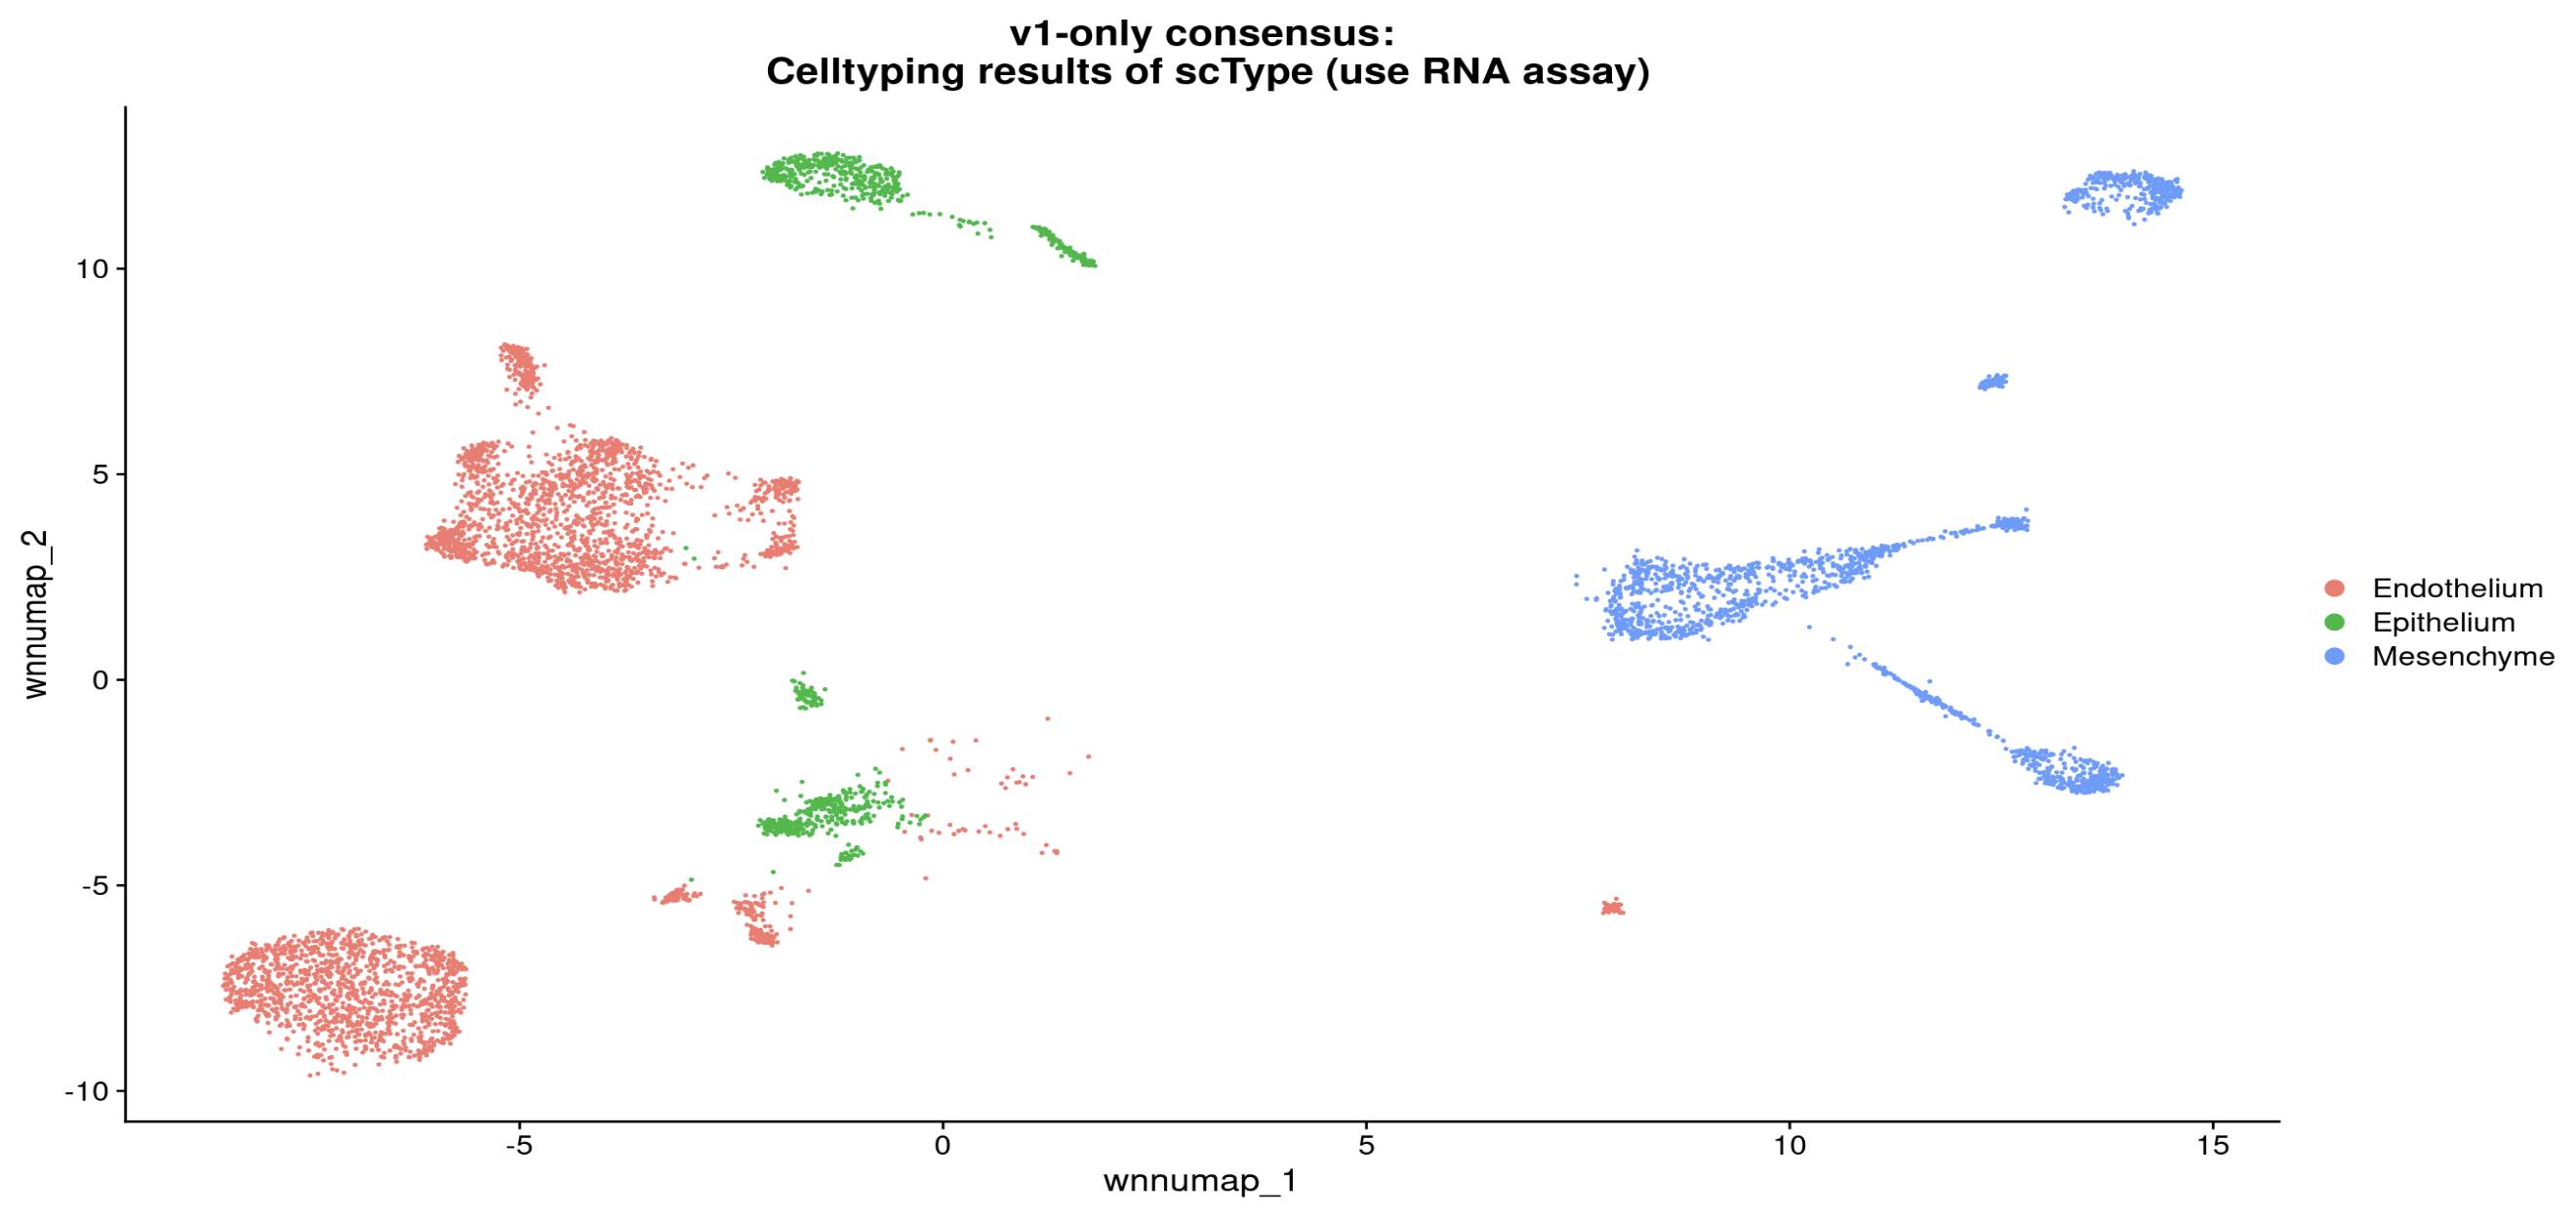
Inspecting only consensus cells still did not make it clear which workflow was preferable.