Project Overview
TGIA Analysis Platform is a full-stack bioinformatics web platform that automates RNA-seq and single-cell RNA sequencing (scRNA-seq) analysis, covering Excel-based request intake, sample/order management, workflow orchestration, and result visualization. The system combines a FastAPI backend, a Vue.js frontend, Celery-based asynchronous task processing, Snakemake pipelines, R scripts for statistical analysis and reporting, and MySQL-backed persistence to support reproducible execution and end-to-end traceability. It also integrates key downstream analyses such as differential expression analysis, enrichment analysis, and protein-protein interaction network analysis.
Highlights
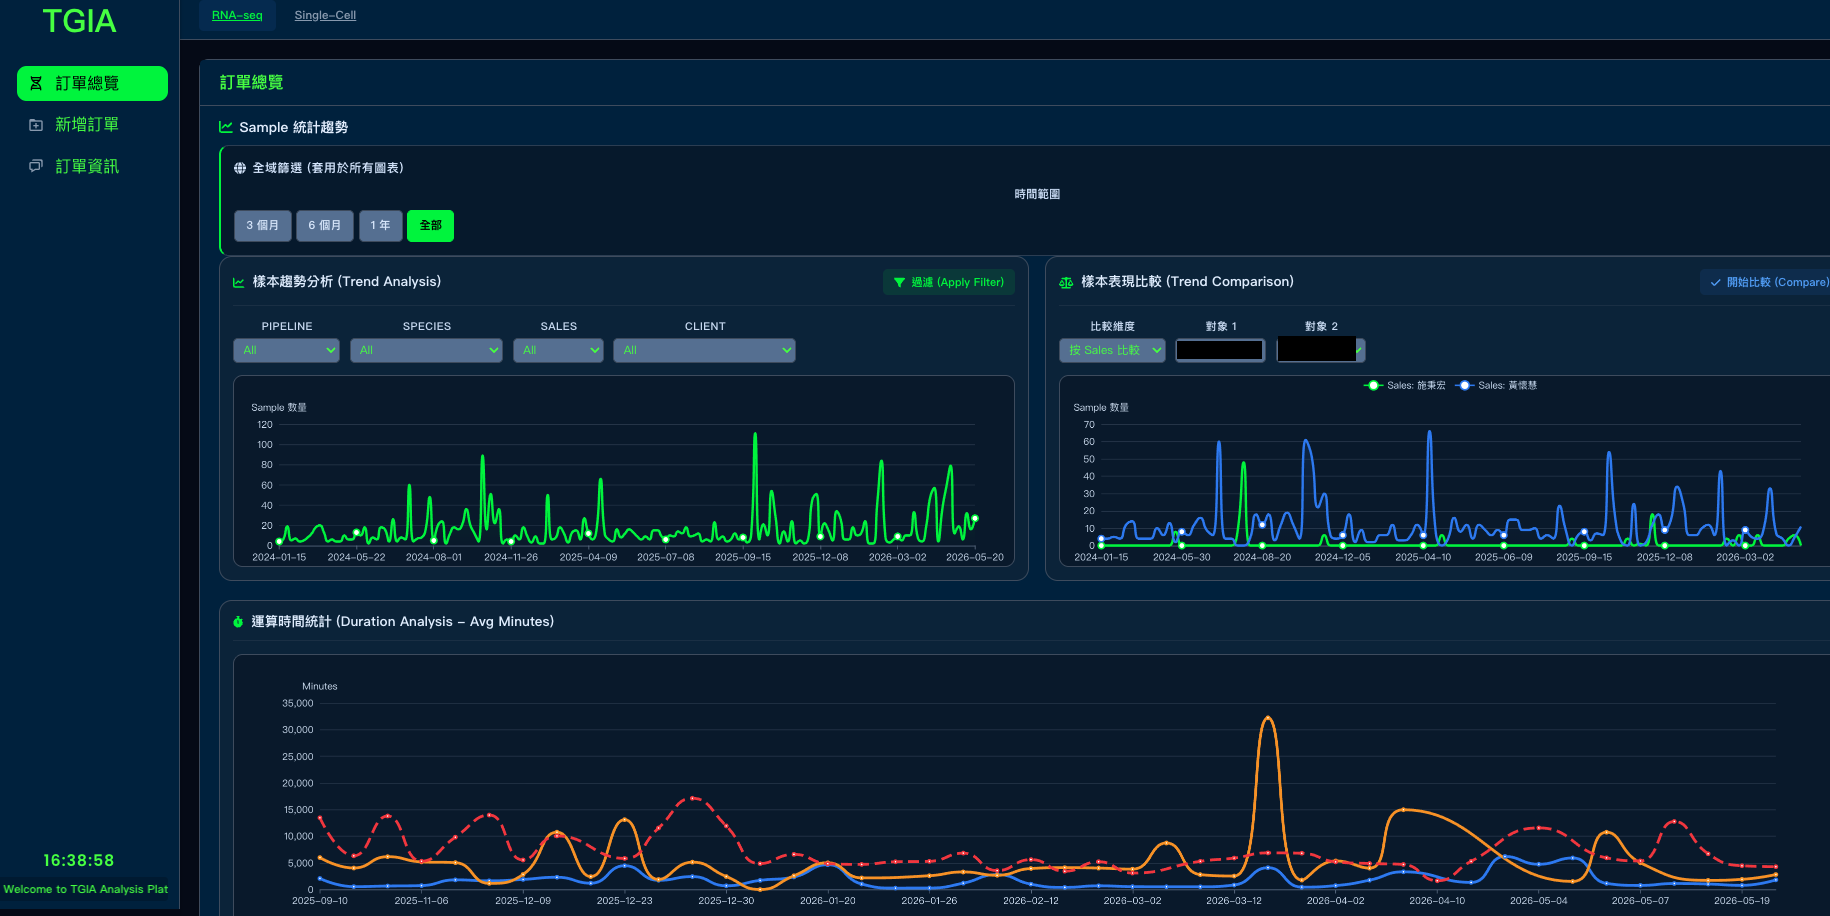
- Users are able to switch between 2 main pipelines on the top of the page.
- Bulk RNAseq
- scRNAseq
- Users are able to switch between main page, create analysis and analysis detail on the side bar on left.
- On the main page, there are 2 sections:
- General Dashboard
- Analysis Table
General Dashboard: Trend, Distribution and Statistics
The General Dashboard provides a high-level operational view of sequencing orders by visualizing sample trends, comparison statistics, processing durations, pending time by sales representative, and data distributions across key dimensions such as species, pipeline, client, and sales. It includes global time-range filtering and interactive charts to help users quickly monitor workload patterns and identify operational bottlenecks.
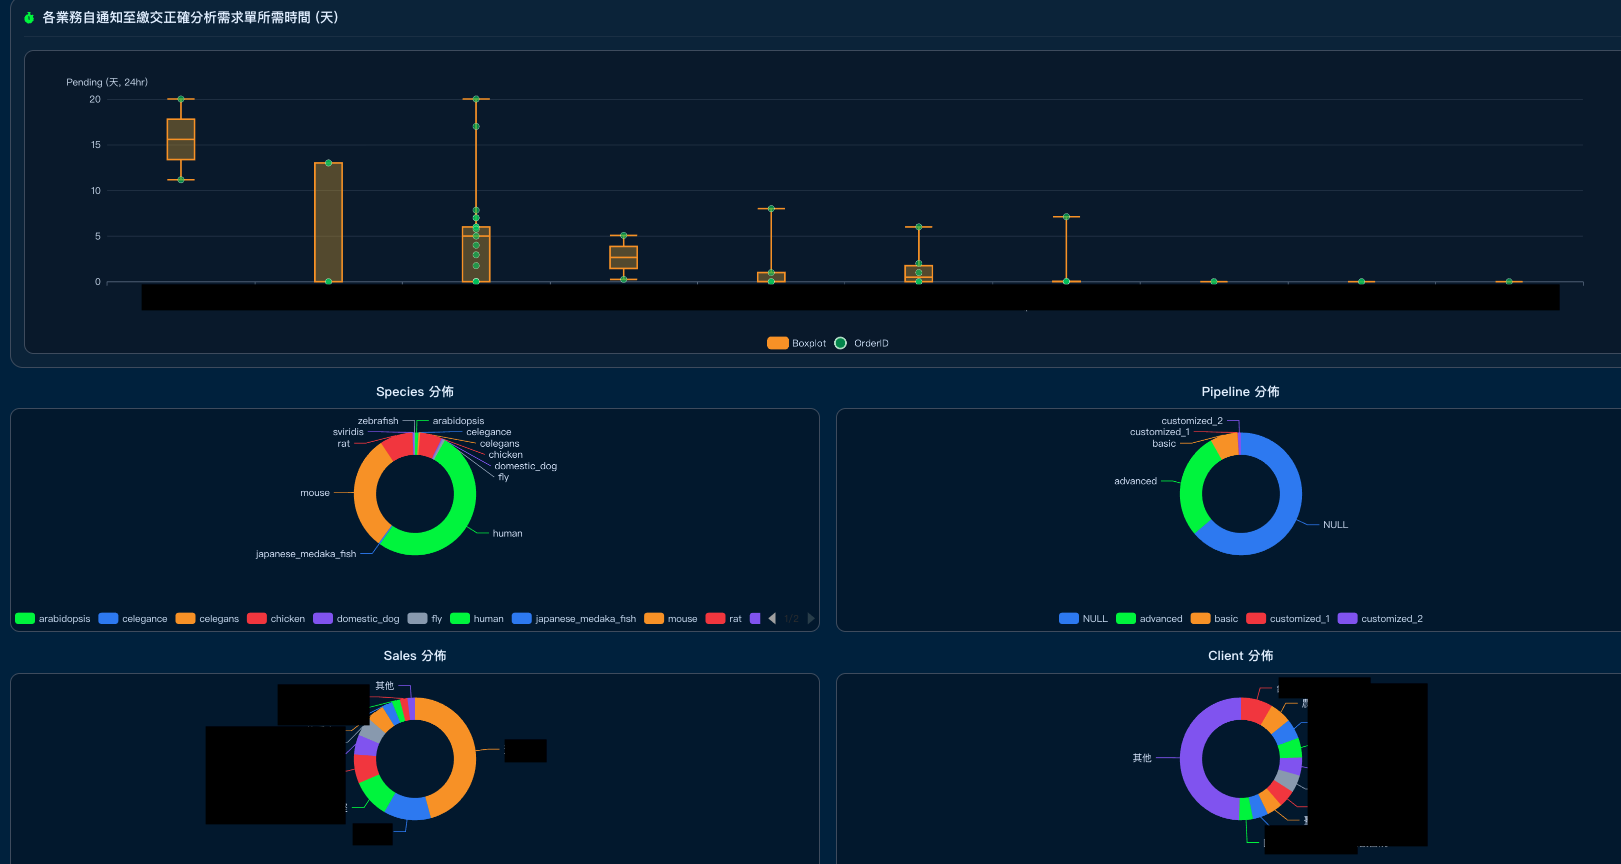
- A global time-range filter applied to all dashboard charts (3m, 6m, 1y, all).
- Sample trend analysis: a line chart showing sample counts over time, filterable by Pipeline, Species, Sales, and Client.
- Trend comparison: a comparison chart that contrasts sample trends between two selected Sales or Client groups.
- Duration analysis: average processing time in minutes for merge process, advanced pipeline, and sample processing.
- Pending-time analysis by sales: a boxplot plus scatter points showing how long each sales owner takes from notification to submitting a correct analysis request, measured in days.
- Distribution breakdowns: pie charts for Species, Pipeline, Sales, and Client.
Analysis Table: Case Management
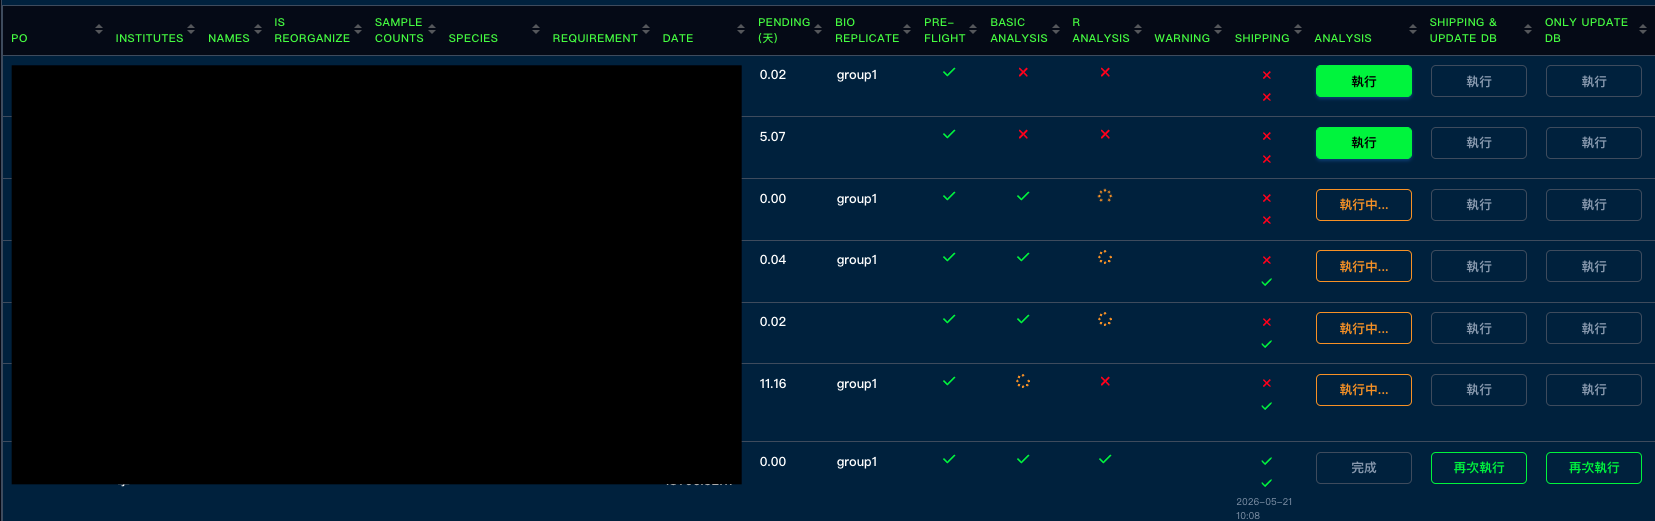
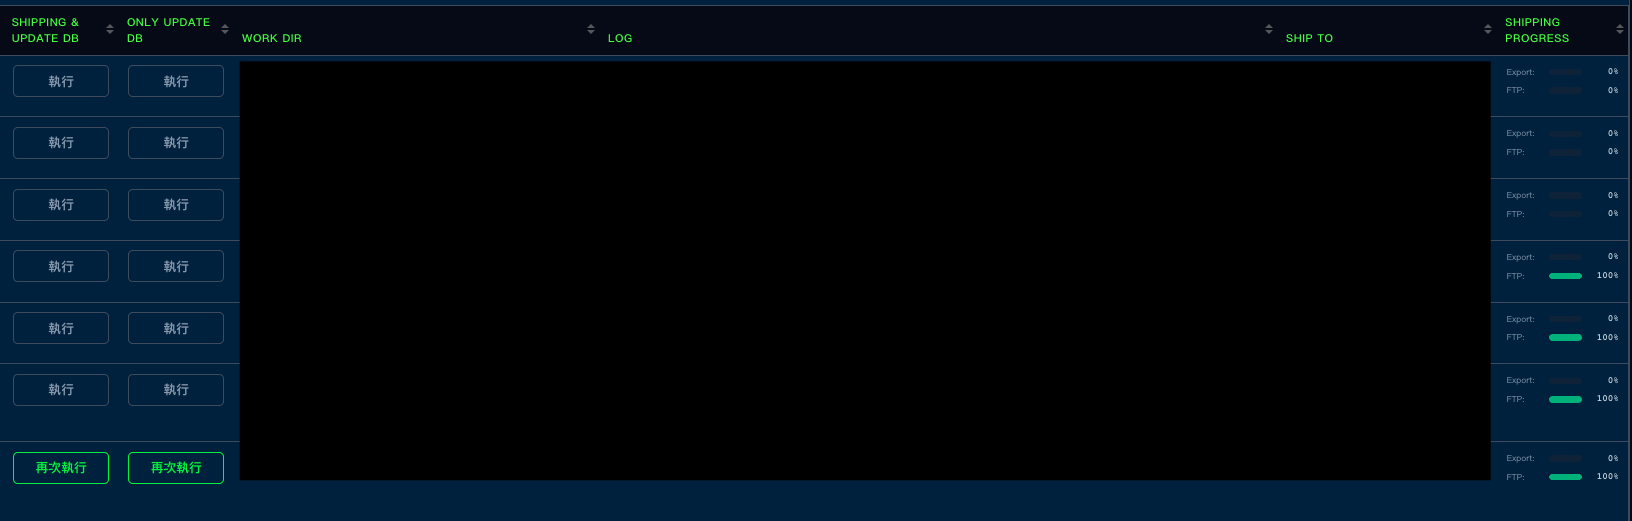
The Analysis Table is a management dashboard, providing a centralized control panel for tracking and operating sequencing orders across the full analysis lifecycle. It combines order metadata, workflow status indicators, log and path visibility, and transfer progress into a searchable, paginated table with automatic refresh, helping users monitor production status and manage analysis execution efficiently.
What Users Can Do
- Search and browse RNAseq orders in a unified table.
- View key order metadata such as sample count, species, pipeline, client, and date.
- Track workflow stages including pre-flight checks, basic analysis, R analysis, result export, and FTP transfer.
- Trigger analysis for orders that are ready to run.
- Ship results to the output destination and update the database.
- Perform record-only updates without running a shipping transfer.
- Inspect work directories, logs, output paths, and shipping progress.
- See file-readiness warnings and missing FASTQ hints before launching analysis.
- Open order detail pages for deeper review and troubleshooting.
Order detail pages
The RNAseq order detail page serves as a per-order workspace for reviewing sample metadata, validating species assignments, managing comparison groups, and inspecting downstream analysis outputs. Its QC section acts as a one-click launcher for the full MultiQC HTML report, opening it in a new browser window so users can review sequencing quality in the native MultiQC interface without leaving the order context. What Users Can Do
- Review order information, sample lists, and analysis parameters.
- Check BLAST-based species validation results and rerun analysis if the species is incorrect.
- View, edit, add, or delete comparison groups for differential expression analysis.
Browse downstream result tabs such as DEG, ORA, GSEA, and Pathview outputs→ To Be Developed- Open the full MultiQC report in a new window for quality control review.
run_status: Track the Progress of Each Case
The project uses a database-driven workflow state model to coordinate long-running analysis, result delivery, and UI operations. The orderlist table acts as the source of truth for each order, storing both high-level execution state through run_status and stage-level completion flags such as pre_flight_check, merge_done, and analysis_done. This design allows Celery workers, API endpoints, and the Vue dashboard to share a consistent view of pipeline progress, recover from partial failures, and prevent users from triggering invalid actions.
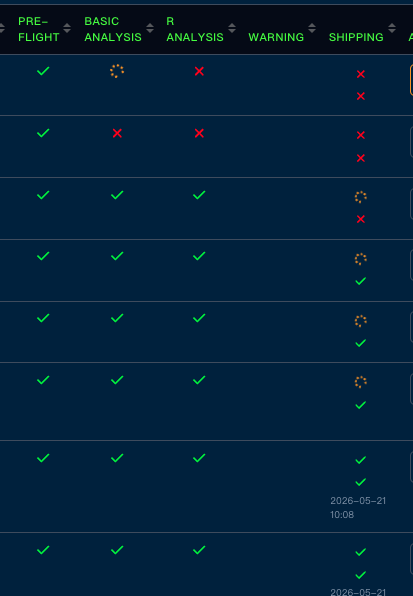
For example
- run_status == 0: Ready to run or basic analysis failed.
- run_status == 1: Basic pipeline is processing, including pre-flight, single-sample processing, and merge.
- run_status == 2: Analysis completed and ready for shipping or database update. … Why I Used run_status I chose to centralize workflow control with run_status because the RNAseq pipeline has many asynchronous stages: pre-flight checks, single-sample processing, merge analysis, advanced R analysis, shipping, FTP transfer, and record-only database updates. If each action were controlled only by scattered if/else checks across individual flags, the logic would quickly become difficult to reason about, especially when handling reruns, failures, partial completion, and user-triggered actions from the dashboard. By using run_status as a single high-level state indicator, the system can clearly define what phase an order is currently in and what actions are allowed next. Downside of Using run_status The main downside is that run_status can become a hidden state machine. If the meaning of each number is not clearly documented and enforced, the system becomes hard to maintain because developers need to remember that 1, 2, 3, 5, 6, 7, 8, and 9 each represent different workflow phases.
Shipping Progress Bar
The RNAseq shipping progress bar is designed to reflect the current transfer state by separating the UI display from the actual transfer mechanism. The backend records transfer state in the database, and the frontend periodically reloads order data to render progress from those DB-backed values. This avoids relying on one-time API responses and keeps the dashboard aligned with long-running background transfers.
When a user clicks shipping…
-
The backend walks all source folders and counts the total number of files to copy.
-
During copy, it increments
items_copiedvariable after each file. -
It calculates:
progress = int((items_copied / total_items) * 100) -
It caps active progress at 99% so the UI does not show completion before all files finish.
platform.sh: How To Activate This Platform
platform.sh is the operational entry point for the TGIA Analysis Platform. It standardizes how the backend API, Celery worker, and Vue frontend are started, stopped, restarted, monitored, and logged through a single tmux-managed script. It allows maintainers to start, stop, restart, monitor, and inspect logs for the backend API, Celery worker, and Vue frontend from one command, instead of manually opening and managing multiple tmux sessions.
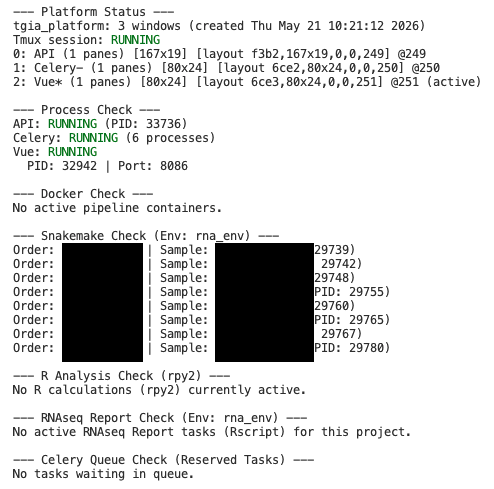
Queued Task Cleanup Logic
The script is especially important during stop and restart, because RNAseq jobs are long-running and Celery may still have active, reserved, scheduled, or queued tasks. The cleanup is done in two phases:
- Phase 1: Before killing workers
- Uses Celery inspect to collect active, reserved, and scheduled task IDs.
- Calls celery.control.revoke(task_id, terminate=True, signal=“SIGKILL”).
- This targets tasks that workers already know about, including running or reserved work.
- Phase 2: After killing workers
- Kills the tmux session and project-related orphan processes such as celery, snakemake, Rscript, main_new.py, and tgia: R_analysis.
- Waits briefly so unacknowledged Celery tasks can return to the broker queue.
- Calls celery.control.purge() to remove queued broker tasks.
- Also directly purges known broker queues through queue_purge() as an extra safety layer.
Tradeoff Explanation
Because the platform depends on multiple long-running services, including FastAPI, Celery, Vue, Snakemake, R scripts, Conda environments, external reference files, mounted storage, and database connections, I used platform.sh as an operational wrapper to make the non-containerized deployment manageable. Instead of requiring maintainers to manually open multiple tmux sessions and remember the correct startup commands, the script centralizes service startup, shutdown, status checks, logs, and Celery queue cleanup.
Database
Database access is implemented through SQLAlchemy ORM, using automap reflection to map existing MySQL tables into Python model classes and context-managed sessions.