Project Overview
This project includes an AI-assisted production dashboard for the TGIA Order system. The dashboard is backed by a corresponding MariaDB database that stores and aggregates operational data, order records, user activity logs, performance metrics, and system health checks. It provides a centralized view for monitoring the platform in real time, helping the team review service status, track order processing, and analyze usage trends more efficiently.
What users can learn from the dashboard
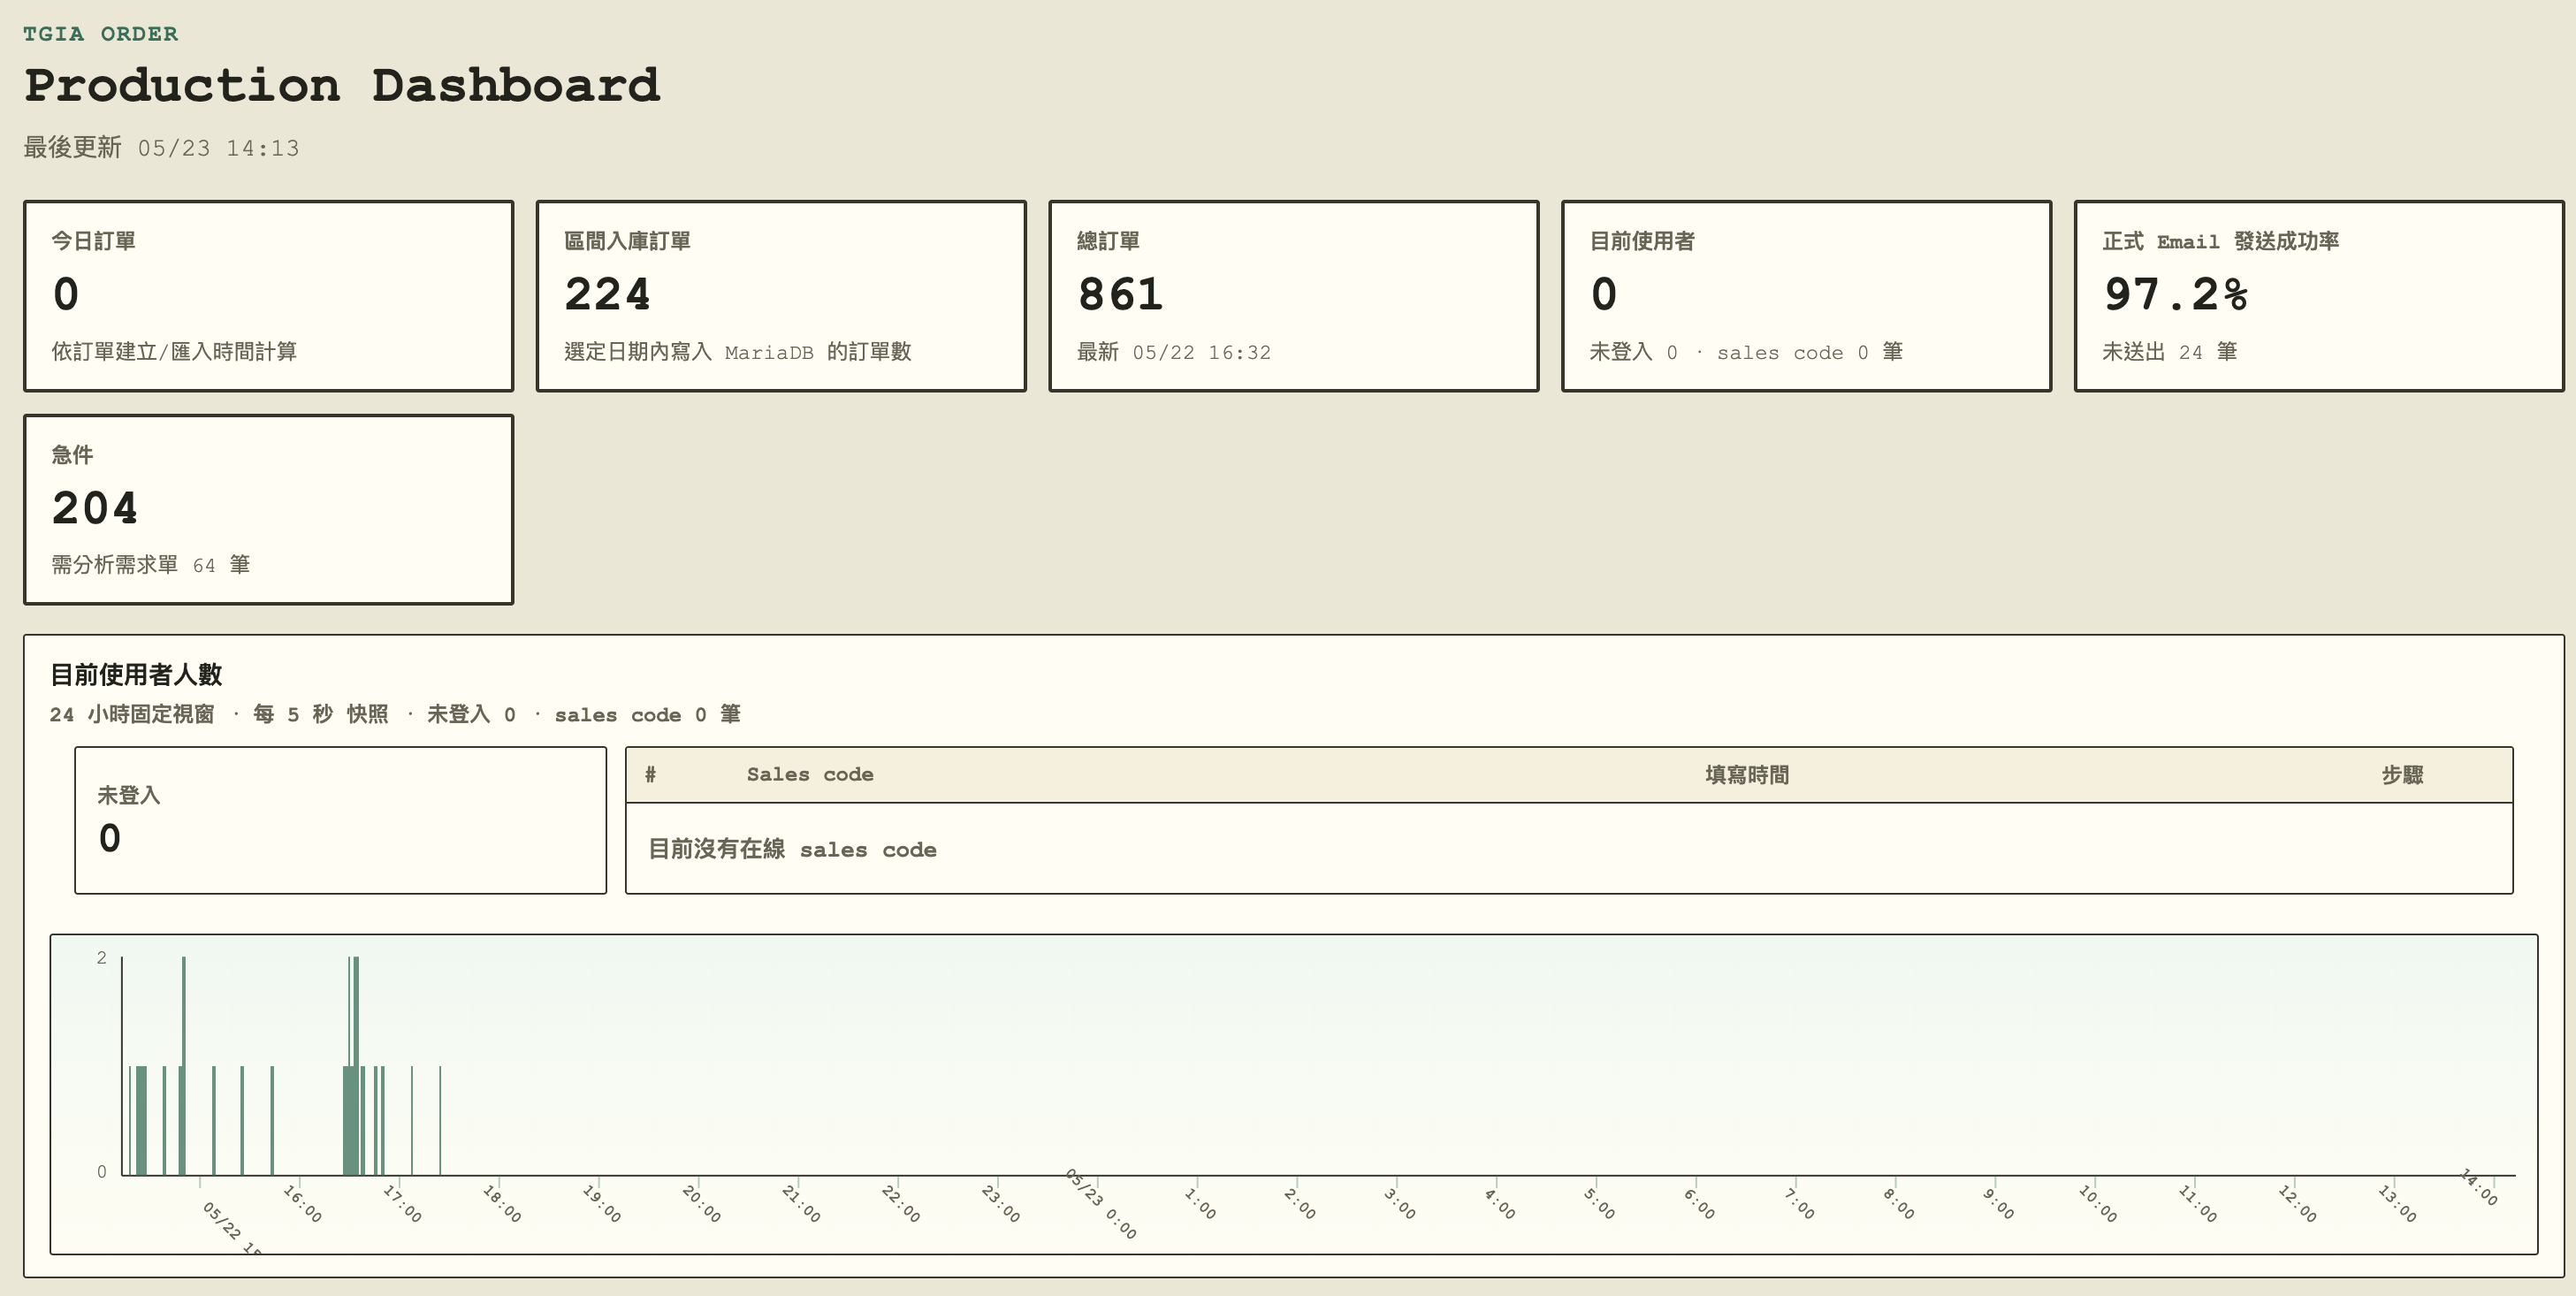
- Current user activity, including total online users, anonymous users, active sales sessions, and a 24-hour presence trend.
- Order statistics, such as total orders, today’s orders, imported orders in a selected date range, urgent orders, and orders requiring analysis requests.
- Recent order details, including order code, customer information, sales contact, form completion time, submission time, email status, and urgency status.
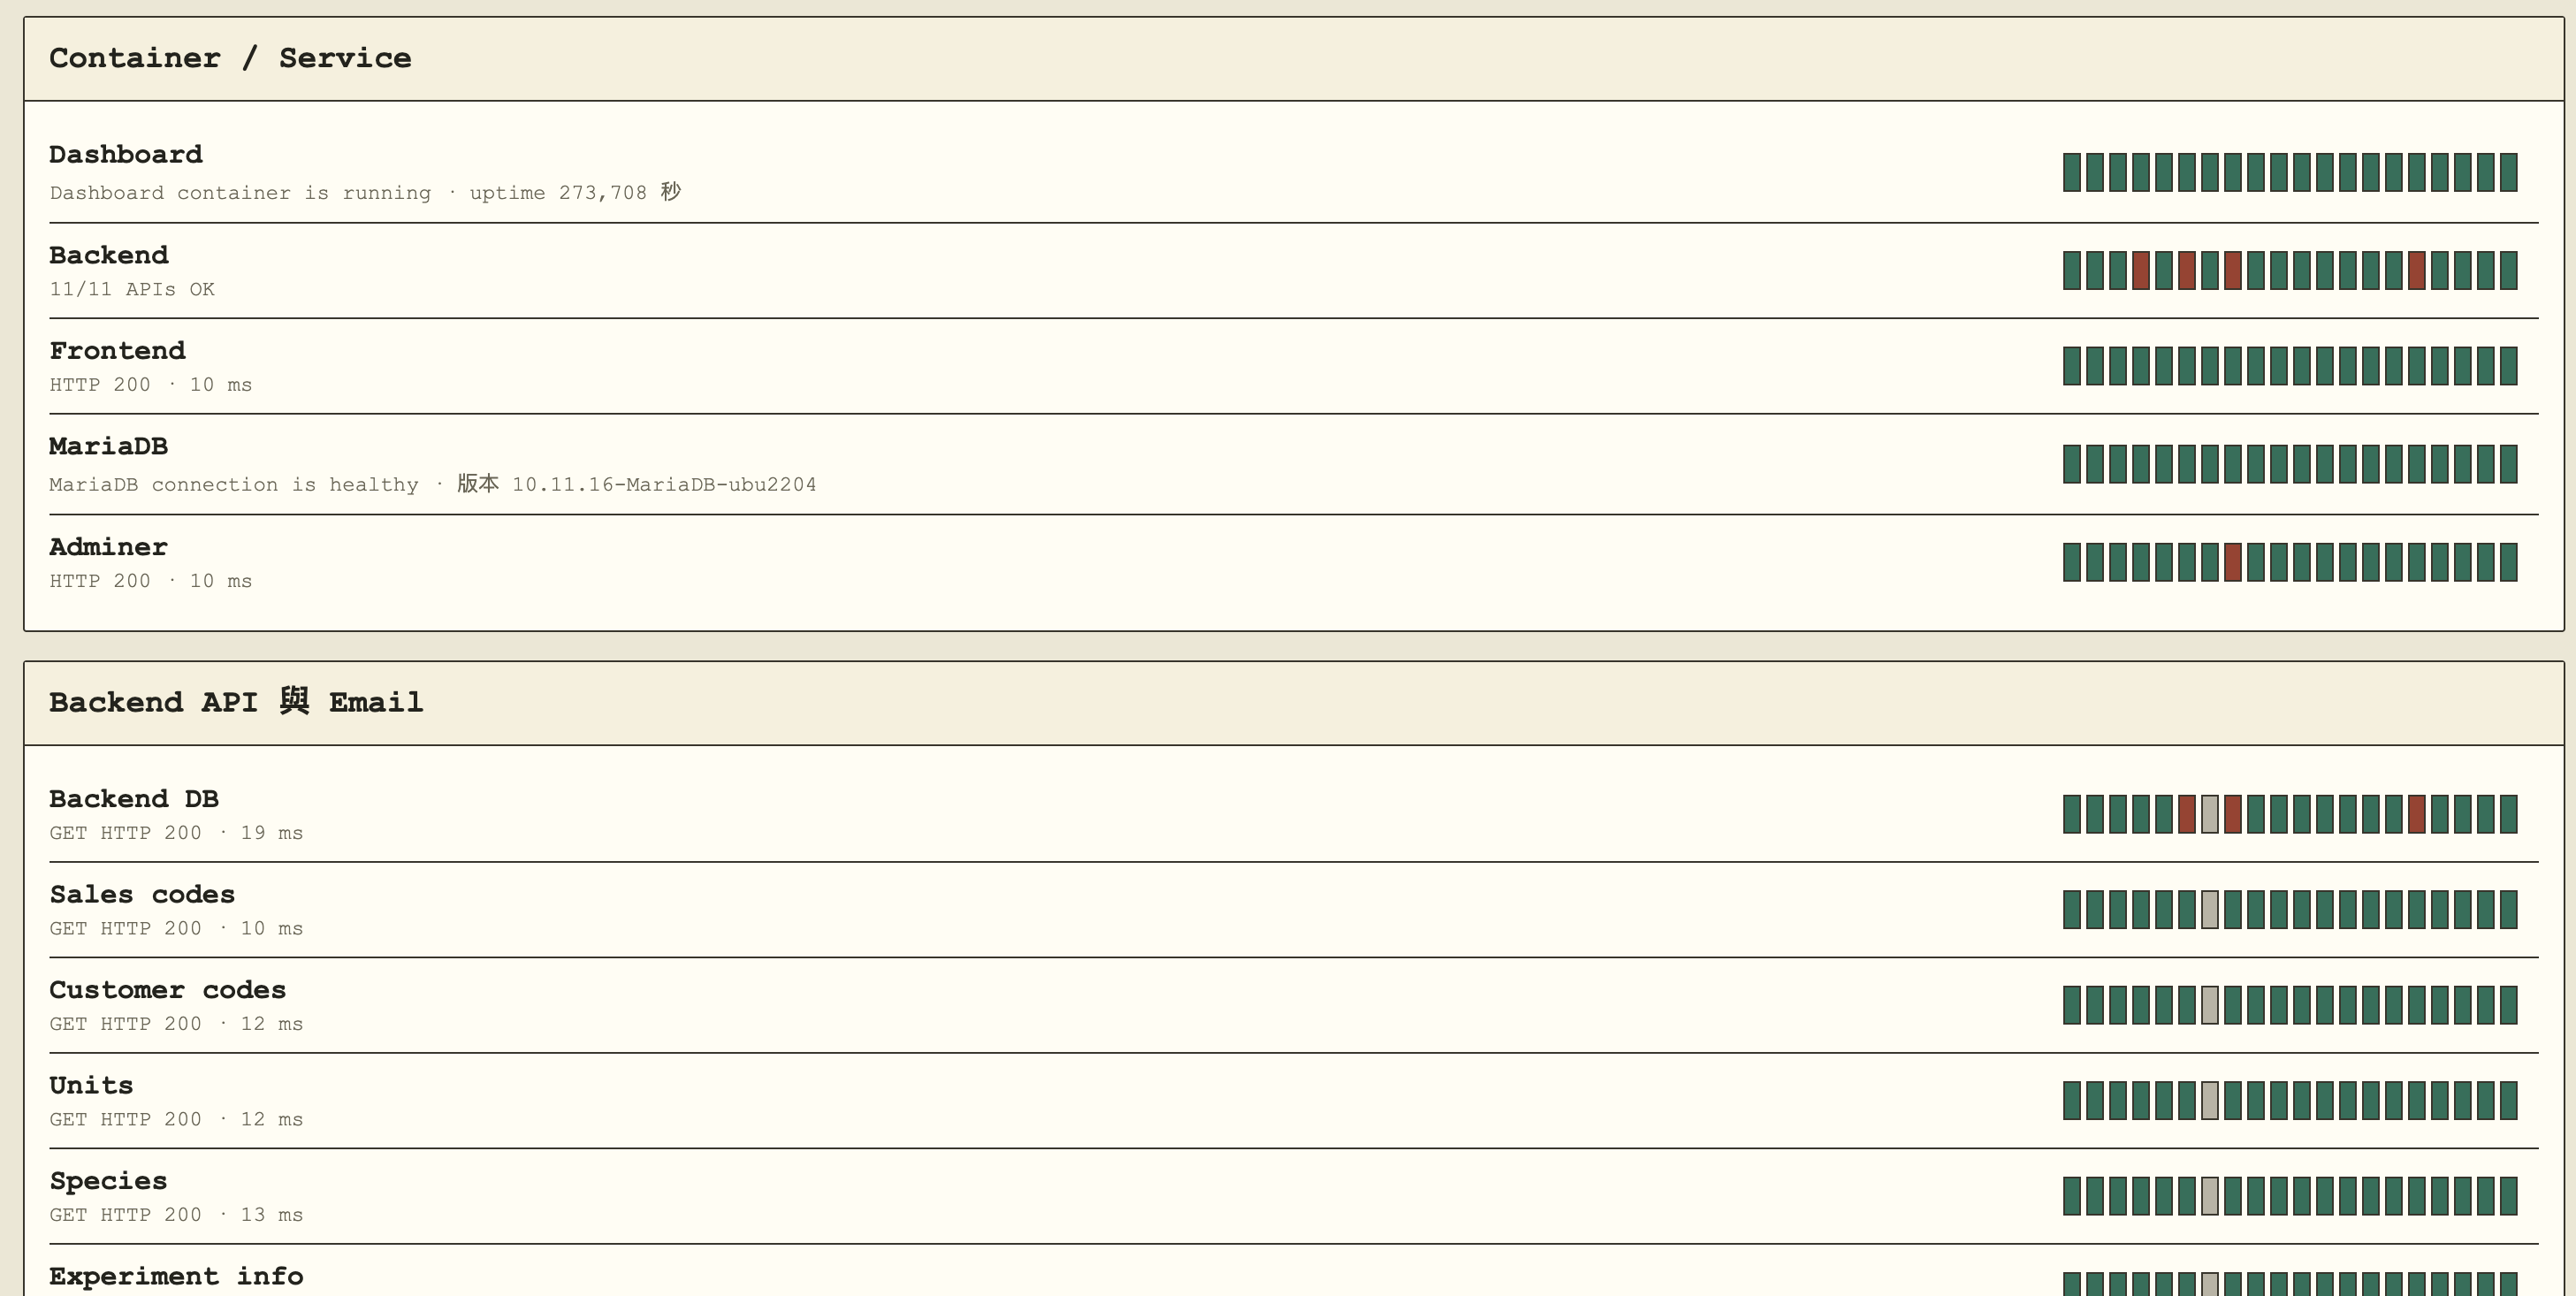
- Service health for the dashboard, backend, frontend, MariaDB, and Adminer.
- Technical health checks for backend APIs, runtime config files, analysis template probes, email configuration, and SMTP connectivity.
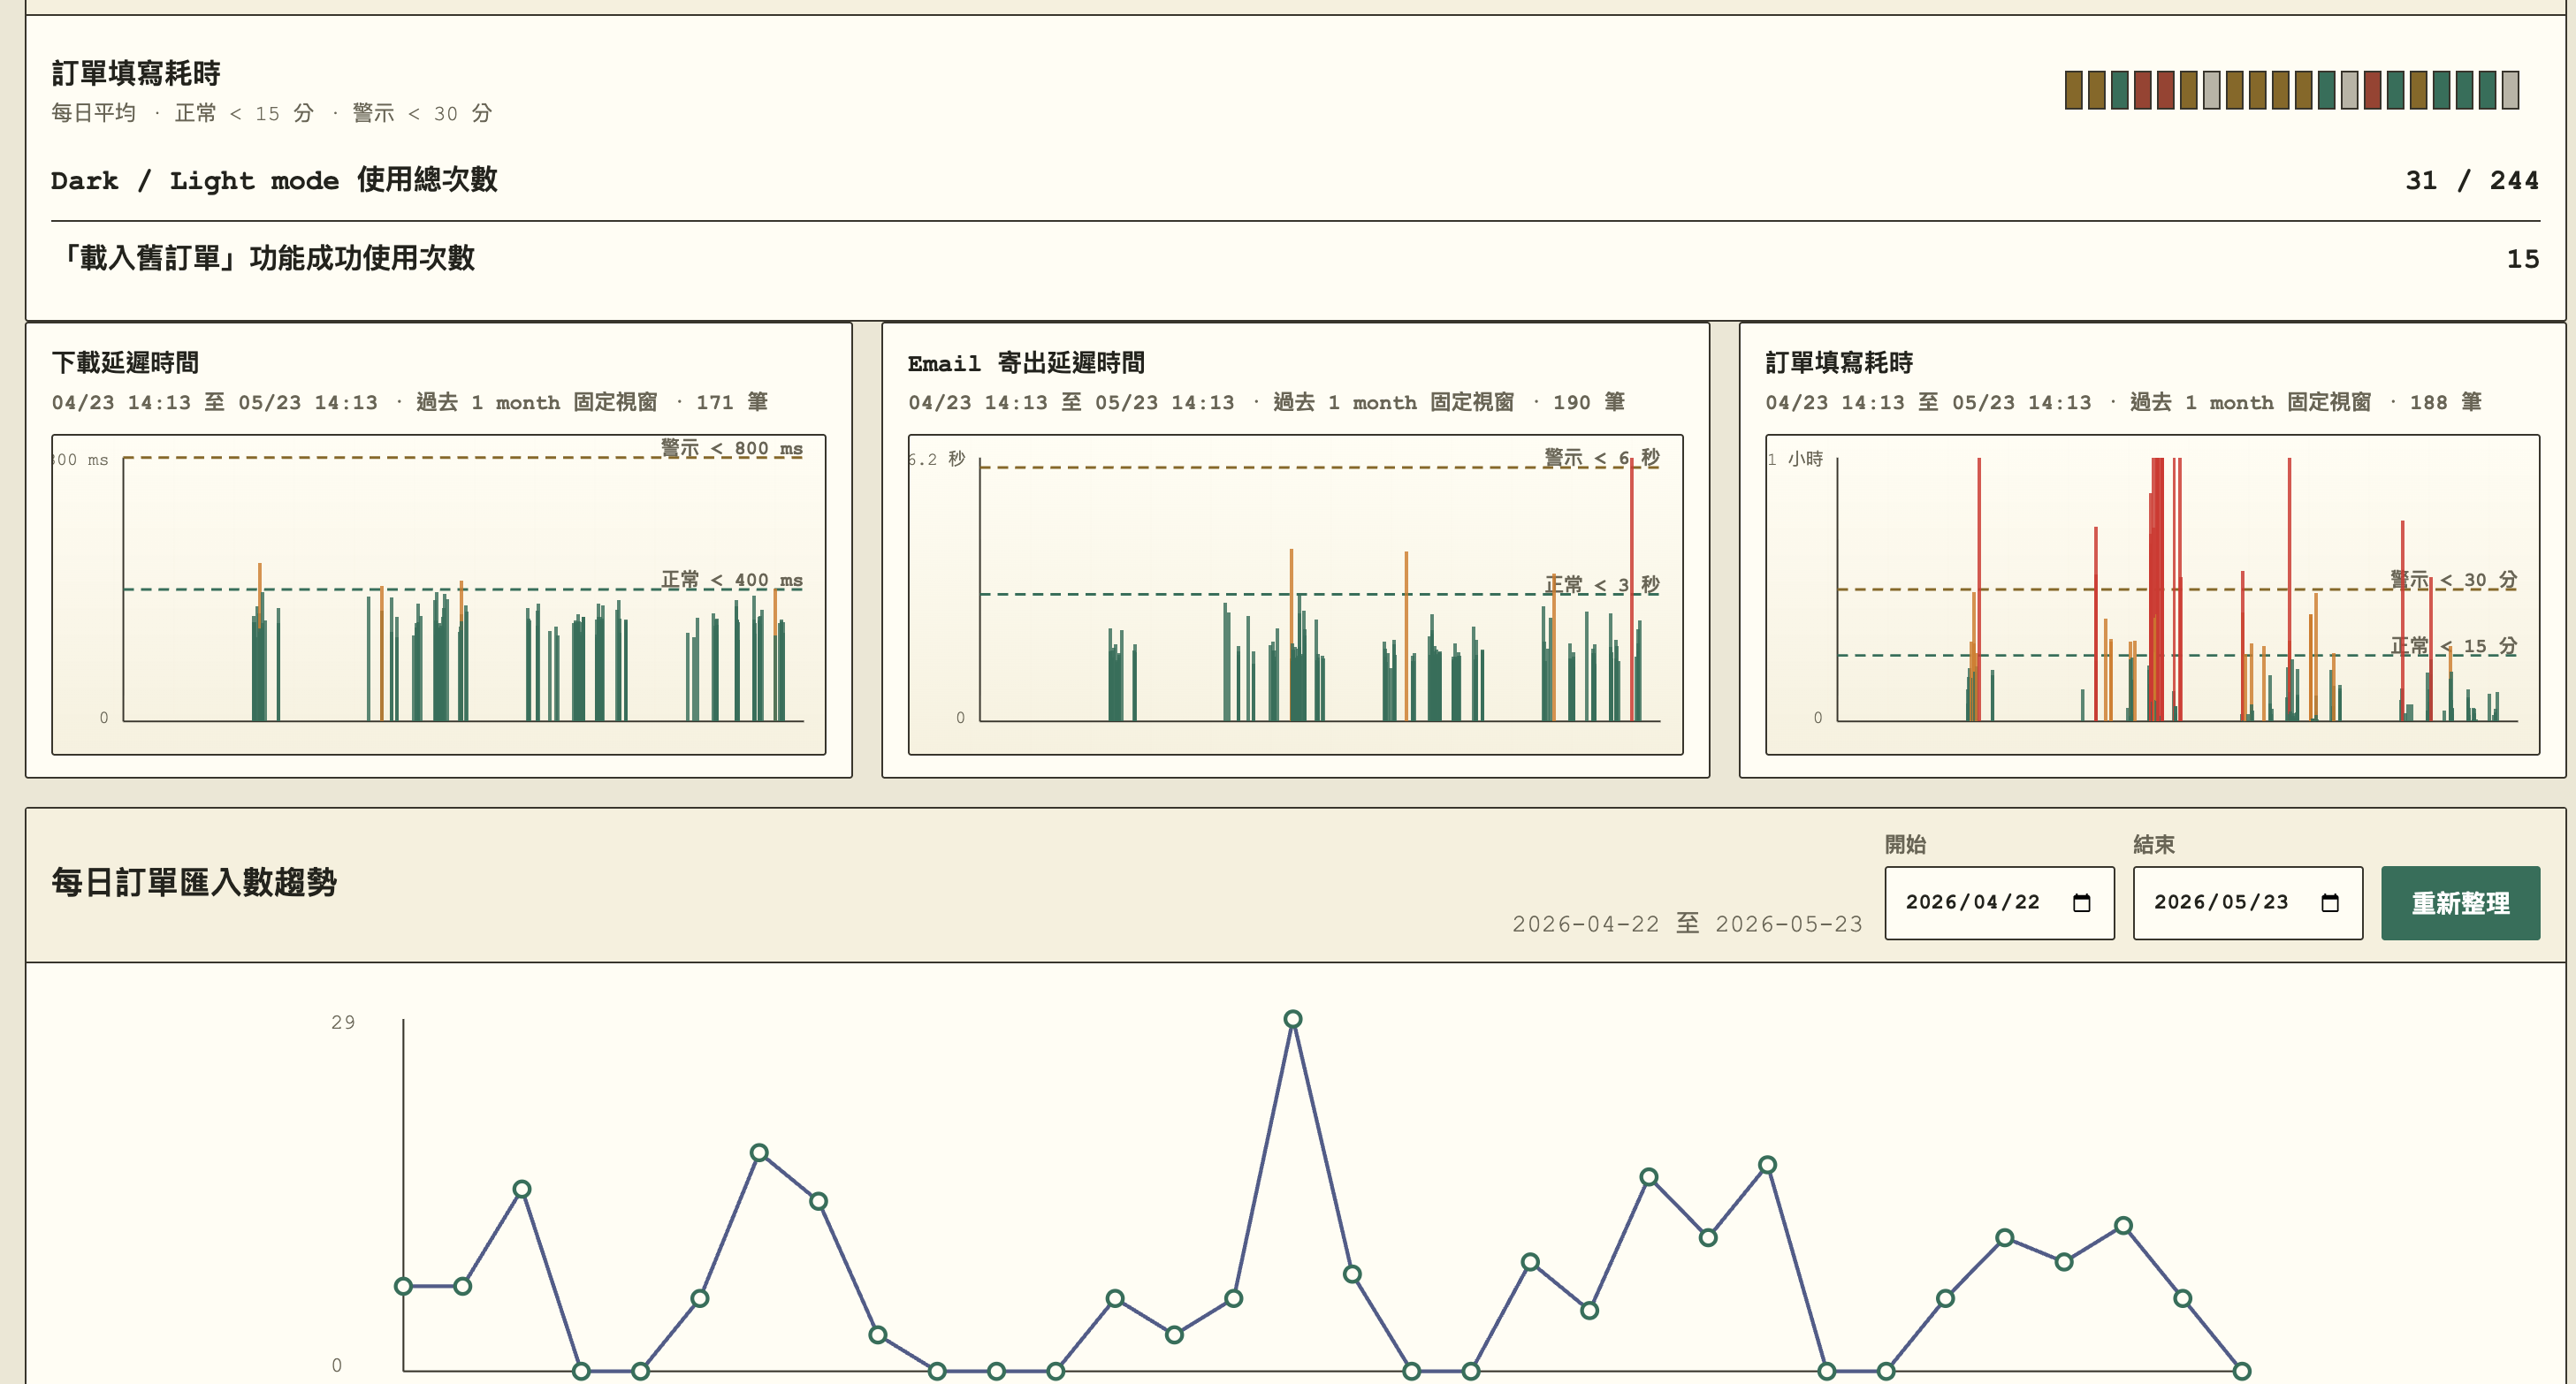
- Performance trends for download latency, analysis template opening time, email delivery latency, and form completion time.
- Analysis template usage, including total downloads, per-template rankings, and recent download history.
- User behavior insights, such as Dark/Light mode usage and “Load Existing Order” usage.
- Daily order import trends with date-range filtering.
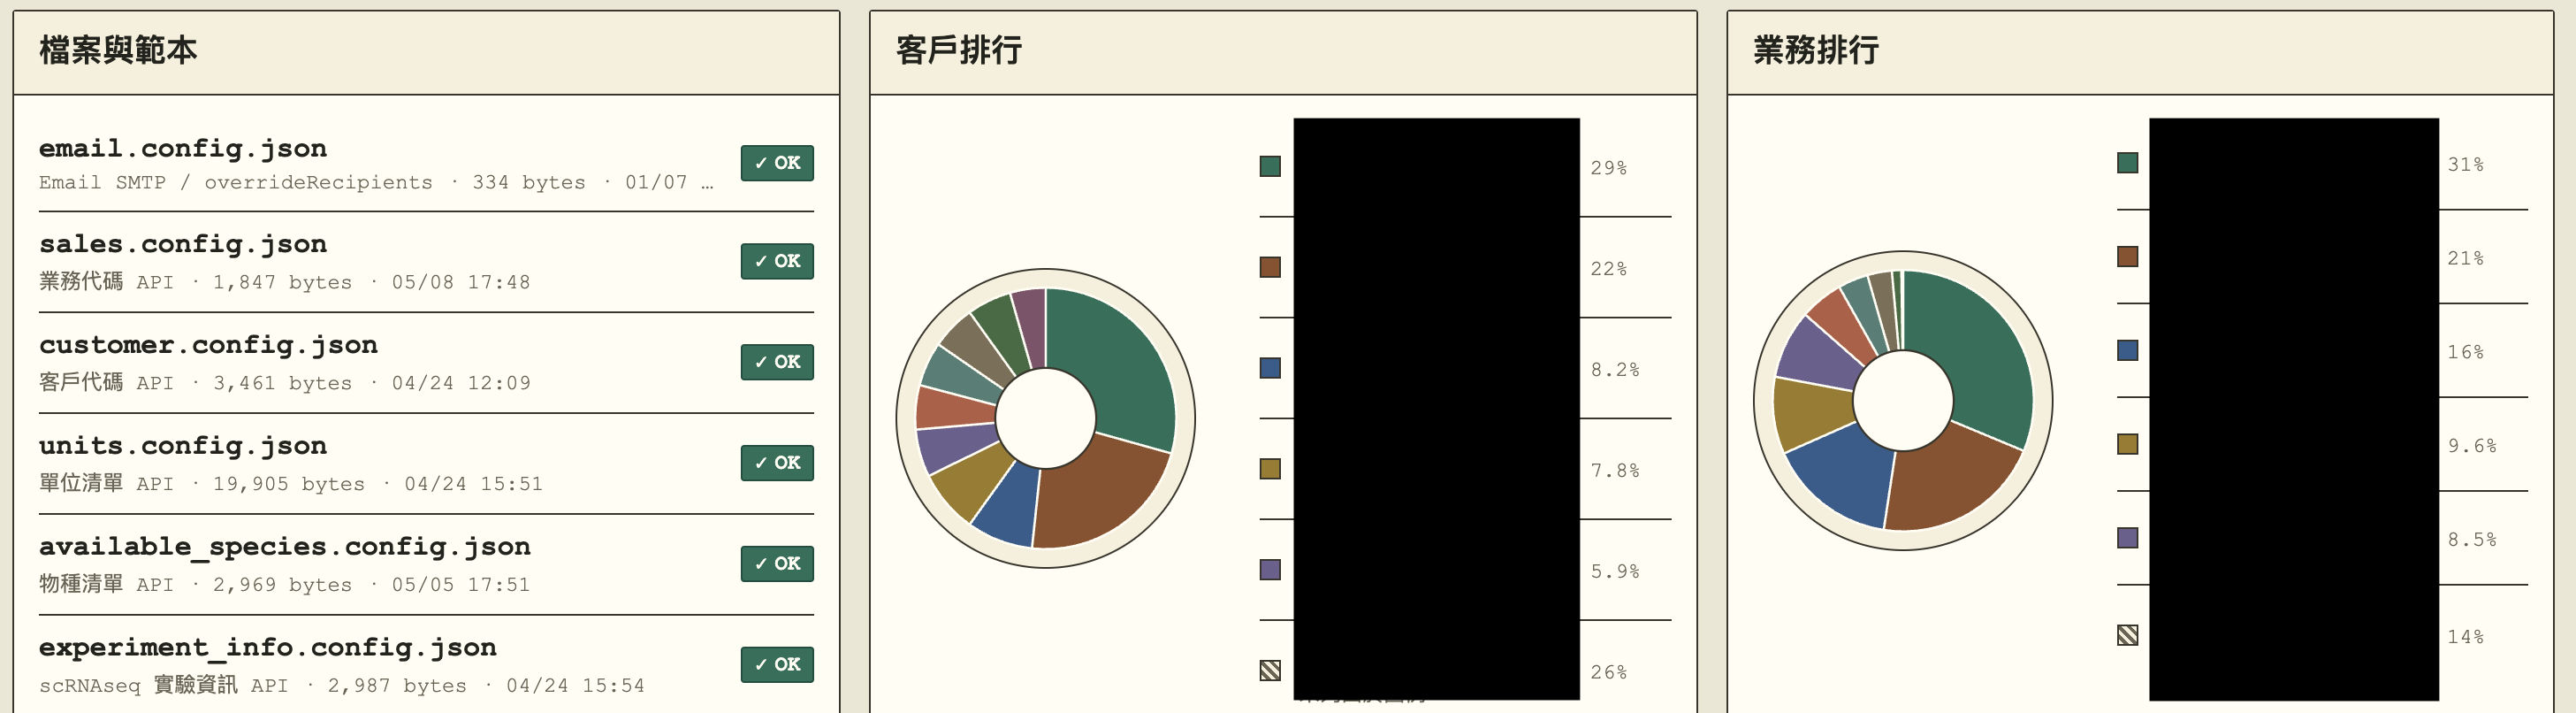
- Ranking charts for customers, sales staff, and service-item selection counts.
- File availability checks for important config files and template files.
Highlights