Project Overview
This project focused on reanalyzing a repeated-measures RNA-seq experiment after correcting sample misassignment. Because multiple tissue or treatment conditions were collected from the same rats, the analysis required models that account for within-individual similarity rather than treating all samples as independent. I compared the original differential expression strategy with two repeated-measures-aware approaches: within-individual normalization followed by limma/duplicateCorrelation, and a mixed model approach using DREAM with rat identity as a random effect. Follow-up gene set activity scoring aimed to identify biological signals that were statistically significant and consistently separable at the sample level.
Experiment Design
| SampleID | Cancer | Treatment | mouse | batch | group1 |
|---|---|---|---|---|---|
| Cont_A | A | Cont | m1 | TS250806004 | Cont_A |
| Cont2_A | A | Cont | m2 | TS251117004 | Cont_A |
| Cont3_A | A | Cont | m3 | TS251117004 | Cont_A |
| Cont_B | B | Cont | m1 | TS250806004 | Cont_B |
| Cont2_B | B | Cont | m2 | TS251117004 | Cont_B |
| Cont3_B | B | Cont | m3 | TS251117004 | Cont_B |
| Cont_C | C | Cont | m1 | TS250806004 | Cont_C |
| Cont2_C | C | Cont | m2 | TS251117004 | Cont_C |
| Cont3_C | C | Cont | m3 | TS251117004 | Cont_C |
| Treat_A | A | Treat | m4 | TS250819001 | Treat_A |
| Treat2_A | A | Treat | m5 | TS251027006 | Treat_A |
| Treat3_A | A | Treat | m6 | TS251111001 | Treat_A |
| Treat_B | B | Treat | m4 | TS250819001 | Treat_B |
| Treat2_B | B | Treat | m5 | TS251027006 | Treat_B |
| Treat3_B | B | Treat | m6 | TS251111001 | Treat_B |
| Treat_C | C | Treat | m4 | TS250819001 | Treat_C |
| Treat2_C | C | Treat | m5 | TS251027006 | Treat_C |
| Treat3_C | C | Treat | m6 | TS251111001 | Treat_C |
→ Look at the “mouse” COLUMN, this is a repeated measure design. For example:
- m1 → sampleID Cont_A, Cont_B and Cont_C
- m2 → sampleID Cont2_A, Cont2_B, Cont2_C
- m3 → sampleID Cont3_A, Cont3_B, Cont3_C
Original Formula Design
~ group1→ Failed to consider either BATCH or MOUSE COLUMN
Goal and Challenges
-
The difference between Control - Treatment in certain Cancer. We previously design this comparison:
Treat_B vs Cont_B
Treat_A vs Cont_A
Treat_C vs Cont_C
→ However, in Treat_B there were 3 different individual, and in Cont_B there were another 3 different individual
Challenge 1 - Repeated Individuals in Different Samples
Difference between individuals overwrote the difference between groups.
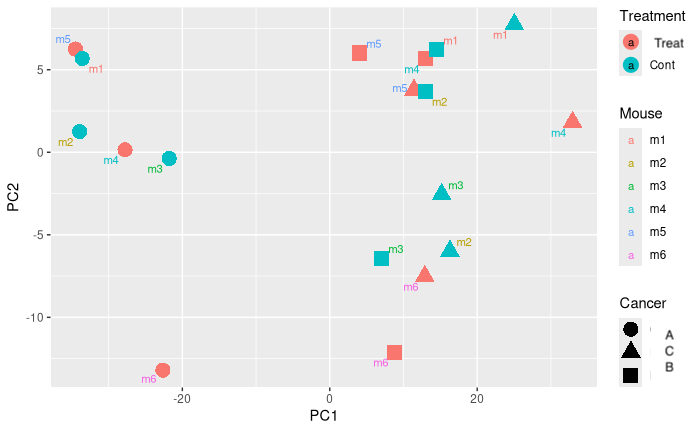
→ The original treatment-only comparison did not account for individual effects across the six rats in Treat_B vs. Cont_B.
Challenge 2 - Sample Correlation
- Samples of cancer B and C were highly correlated, regardless of treatment.
- But the sample of “Cont + cancer C” was very different from cancer A…potentially a outlier?
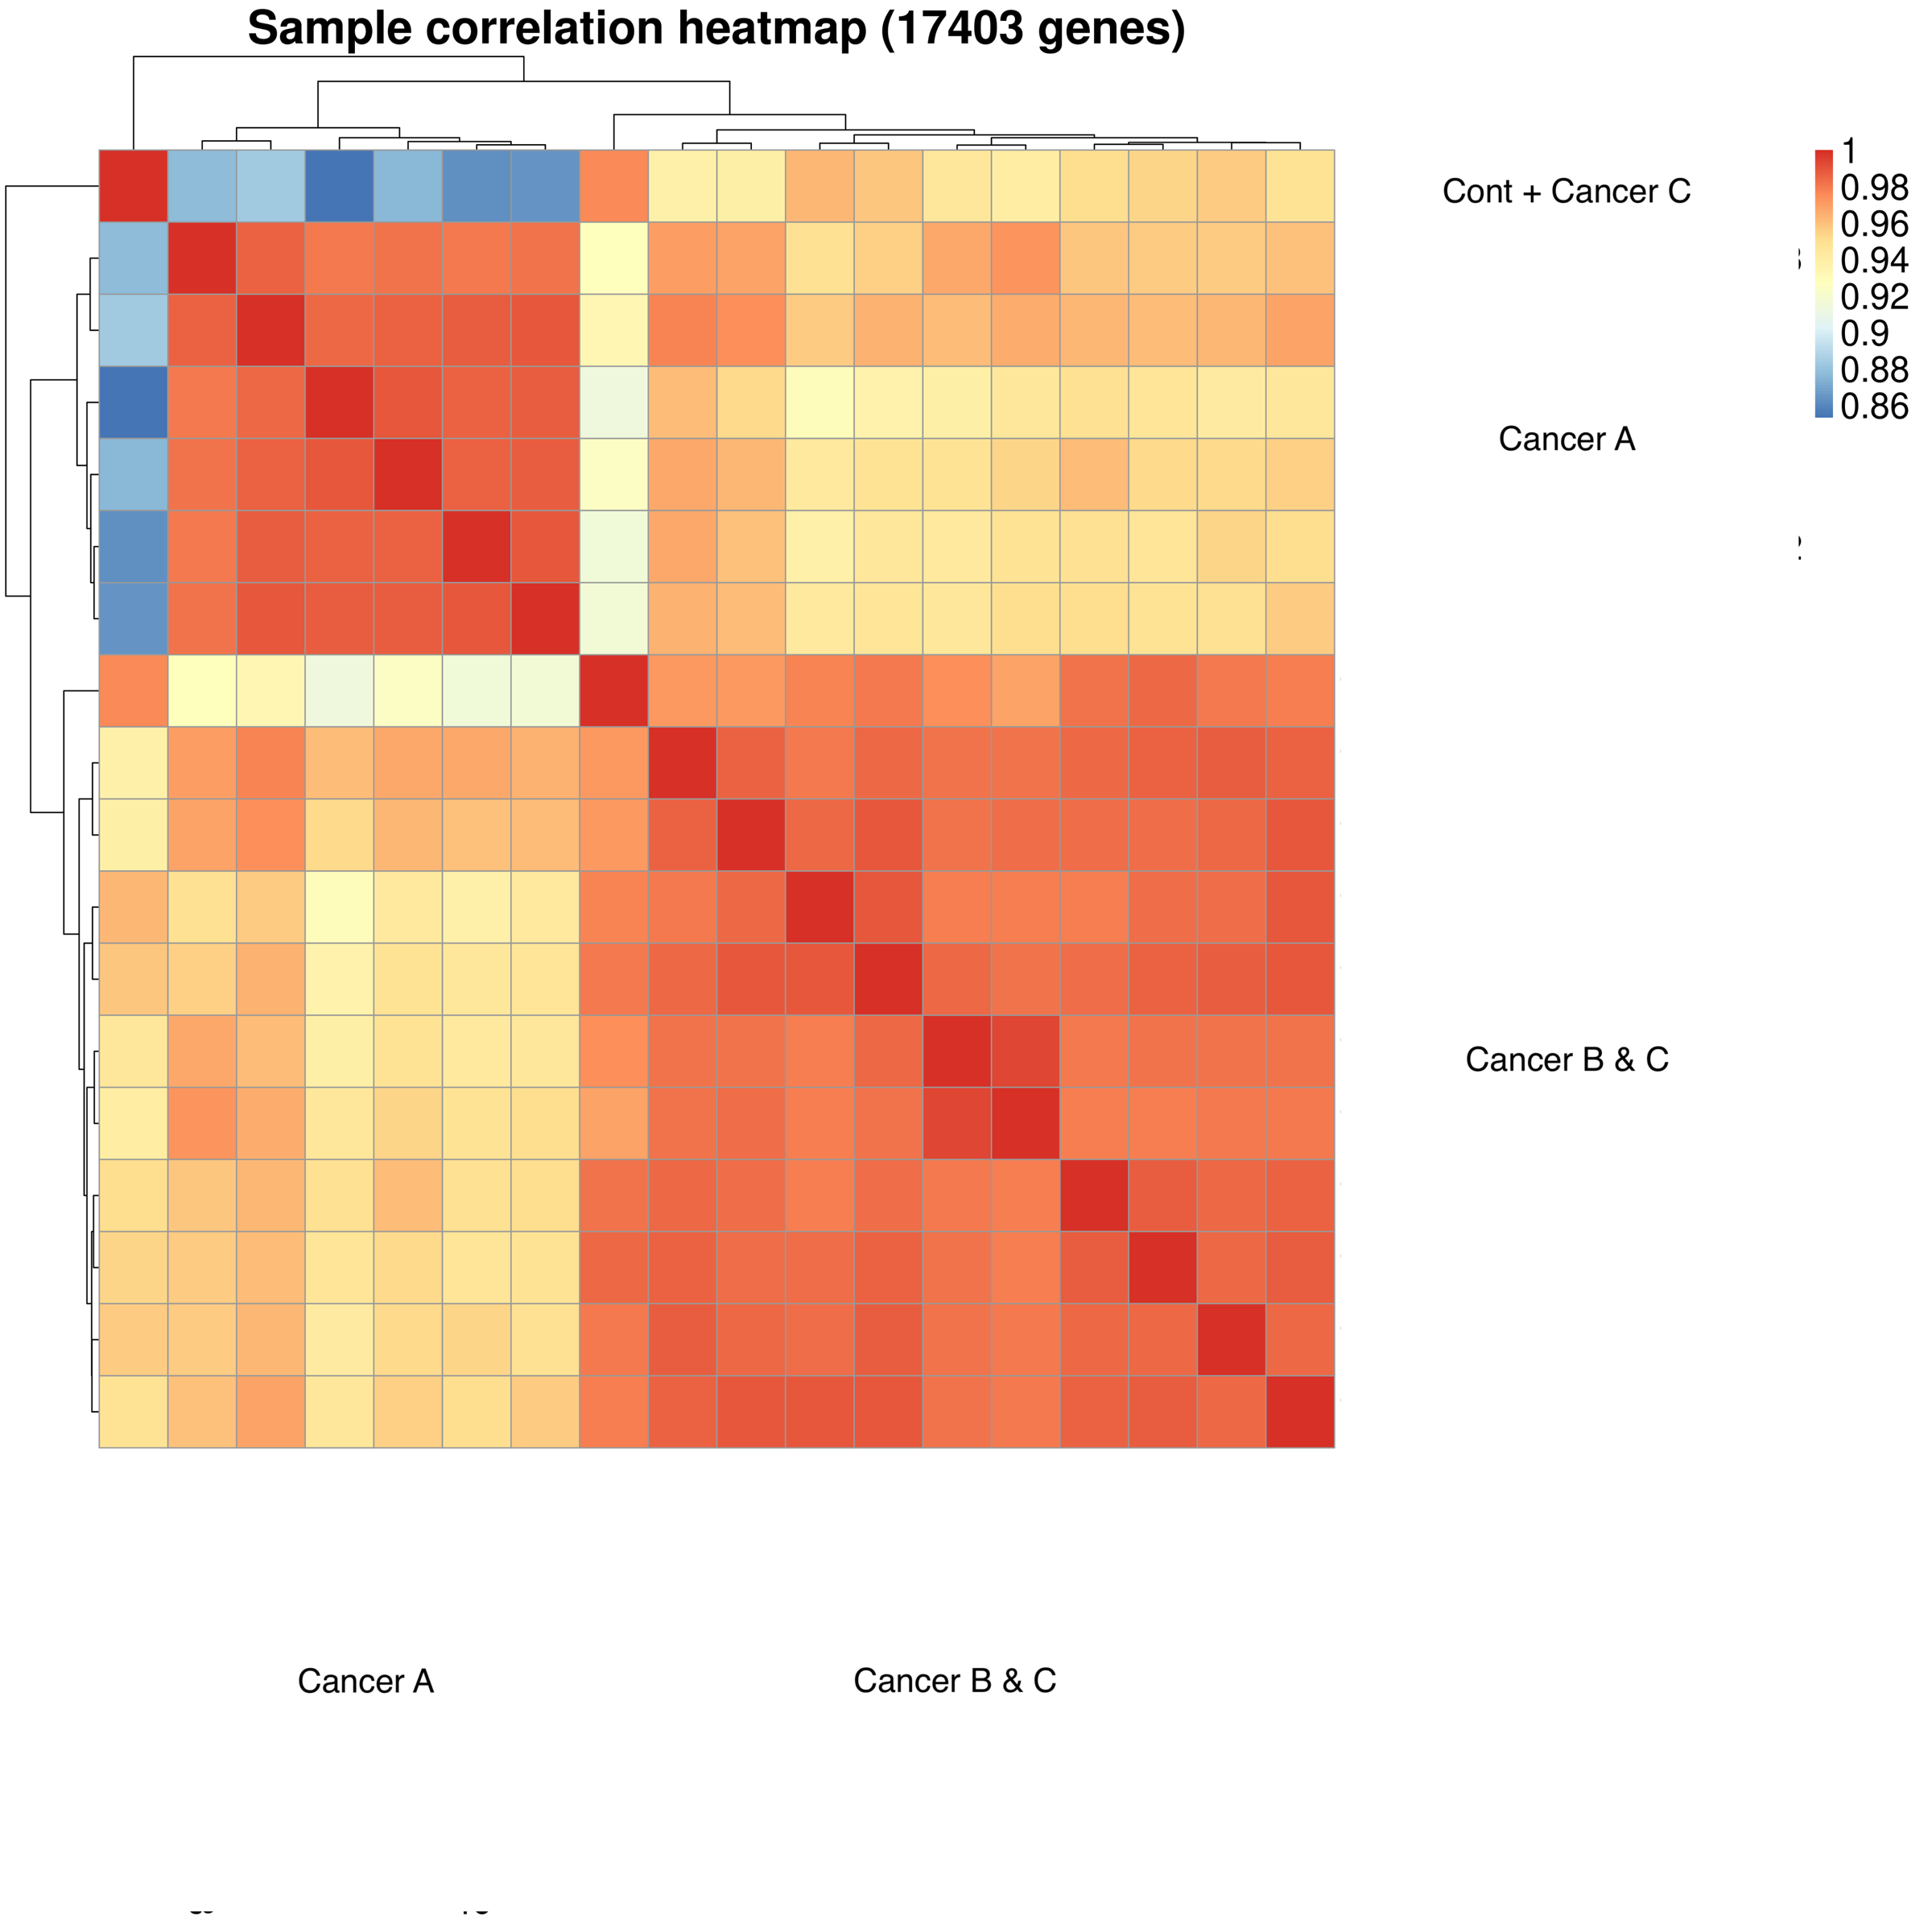
Download original image: Sample correlations across cancer and treatment groups
Summary
The comparisons of interest were:
- The difference of Treatment in cancer B
- The difference of Treatment in cancer C
Main Challenges were…
- The samples of cancer B and C were highly correlated, regardless of treatment.
- Difference between individuals might overwrite the difference between groups.
Method1 - Within Individual Normalization
Since cancer “A” was actually NO CANCER control, we use “A” as base to normalize expression of the other 2 cancer types (B and C) in each individual. Take mouse 1 as example
-
m1 → sampleID Cont_A, Cont_B and Cont_C
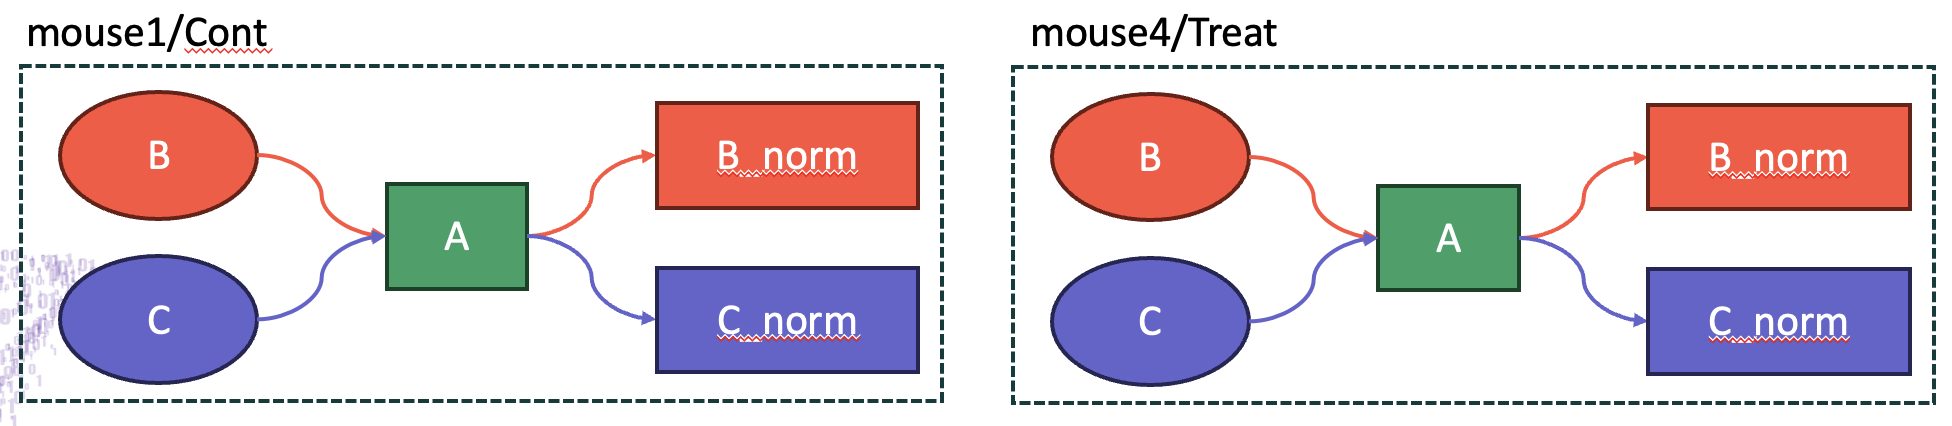
Within-individual normalization using sample A as the baseline
For example, we normalized for m1 and m4 using log
| SampleID | calculate | Cancer | Treatment | mouse | batch |
|---|---|---|---|---|---|
| Cont_B_norm | log(Cont_B+0.5) - log(Cont_A+0.5) | B_norm | Cont | m1 | TS250806004 |
| Cont_C_norm | log(Cont_C+0.5) - log(Cont_A+0.5) | C_norm | Cont | m1 | TS250806004 |
| Treat_B_norm | log(Treat_B+0.5) - log(Treat_A+0.5) | B_norm | Treat | m4 | TS250819001 |
| Treat_C_norm | log(Treat_C+0.5) - log(Treat_A+0.5) | C_norm | Treat | m4 | TS250819001 |
Next, we tested the effect of Treat vs. Cont in cancer B
| SampleID | Cancer | Treatment | mouse | batch |
|---|---|---|---|---|
| Cont_B_norm | B_norm | Cont | m1 | TS250806004 |
| Cont2_B_norm | B_norm | Cont | m2 | TS251117004 |
| Cont3_B_norm | B_norm | Cont | m3 | TS251117004 |
| Treat_B_norm | B_norm | Treat | m4 | TS250819001 |
| Treat2_B_norm | B_norm | Treat | m5 | TS251027006 |
| Treat3_B_norm | B_norm | Treat | m6 | TS251111001 |
The treatment-only design becomes easier to explain:
~ TreatmentValidation
From left (before within individual normalization) to right (after within individual normalization)
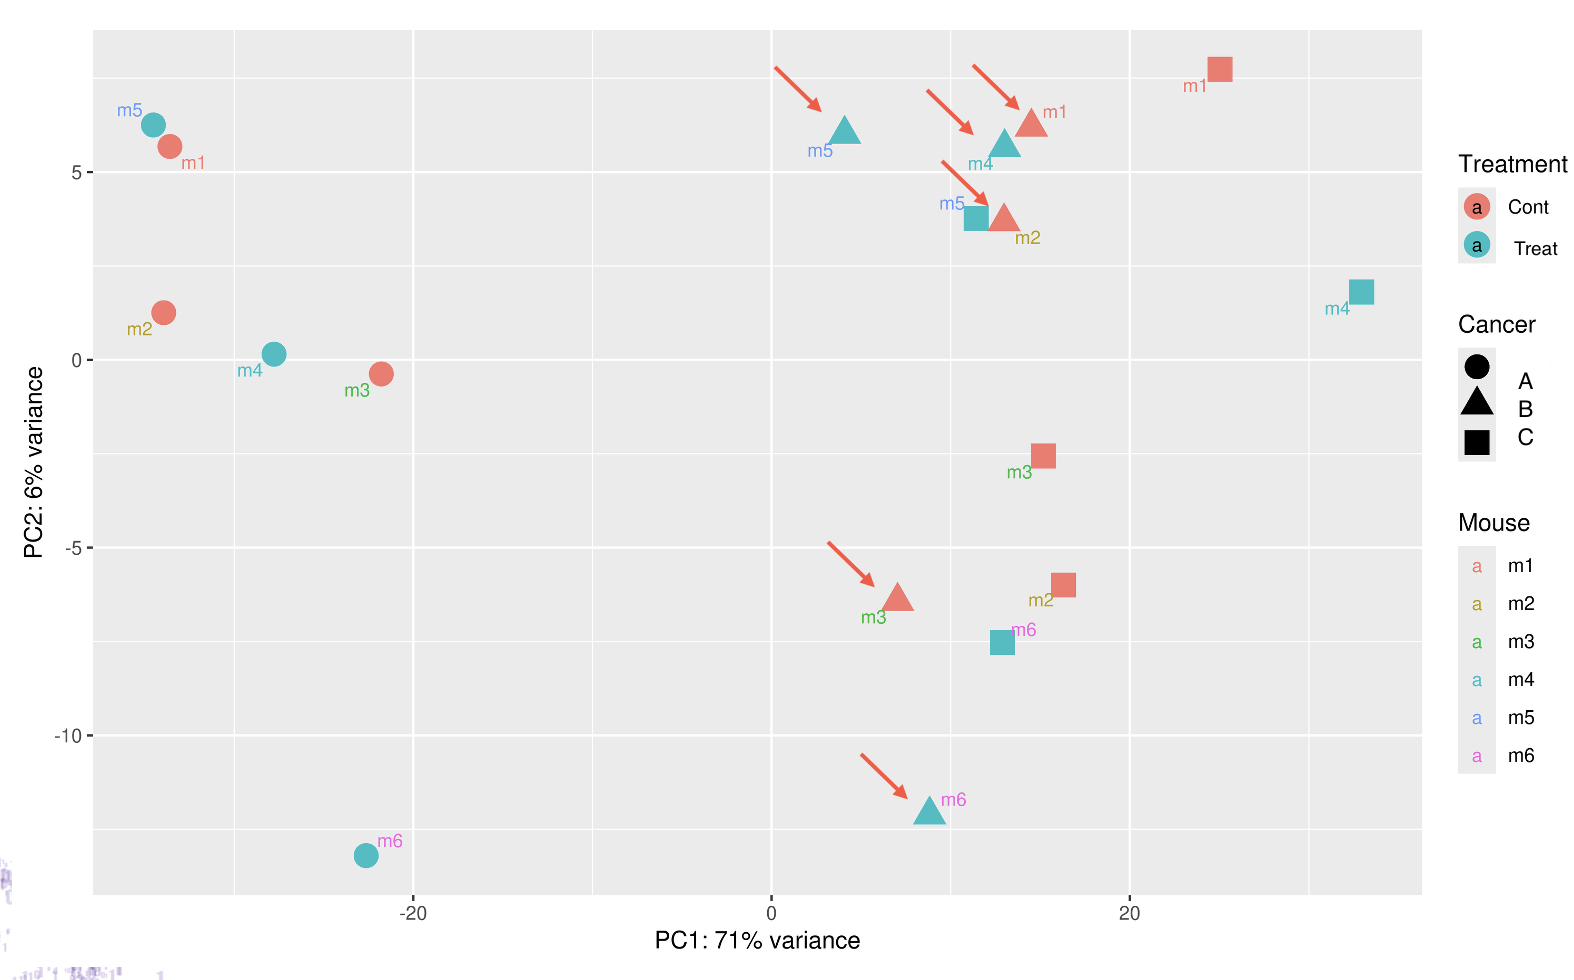
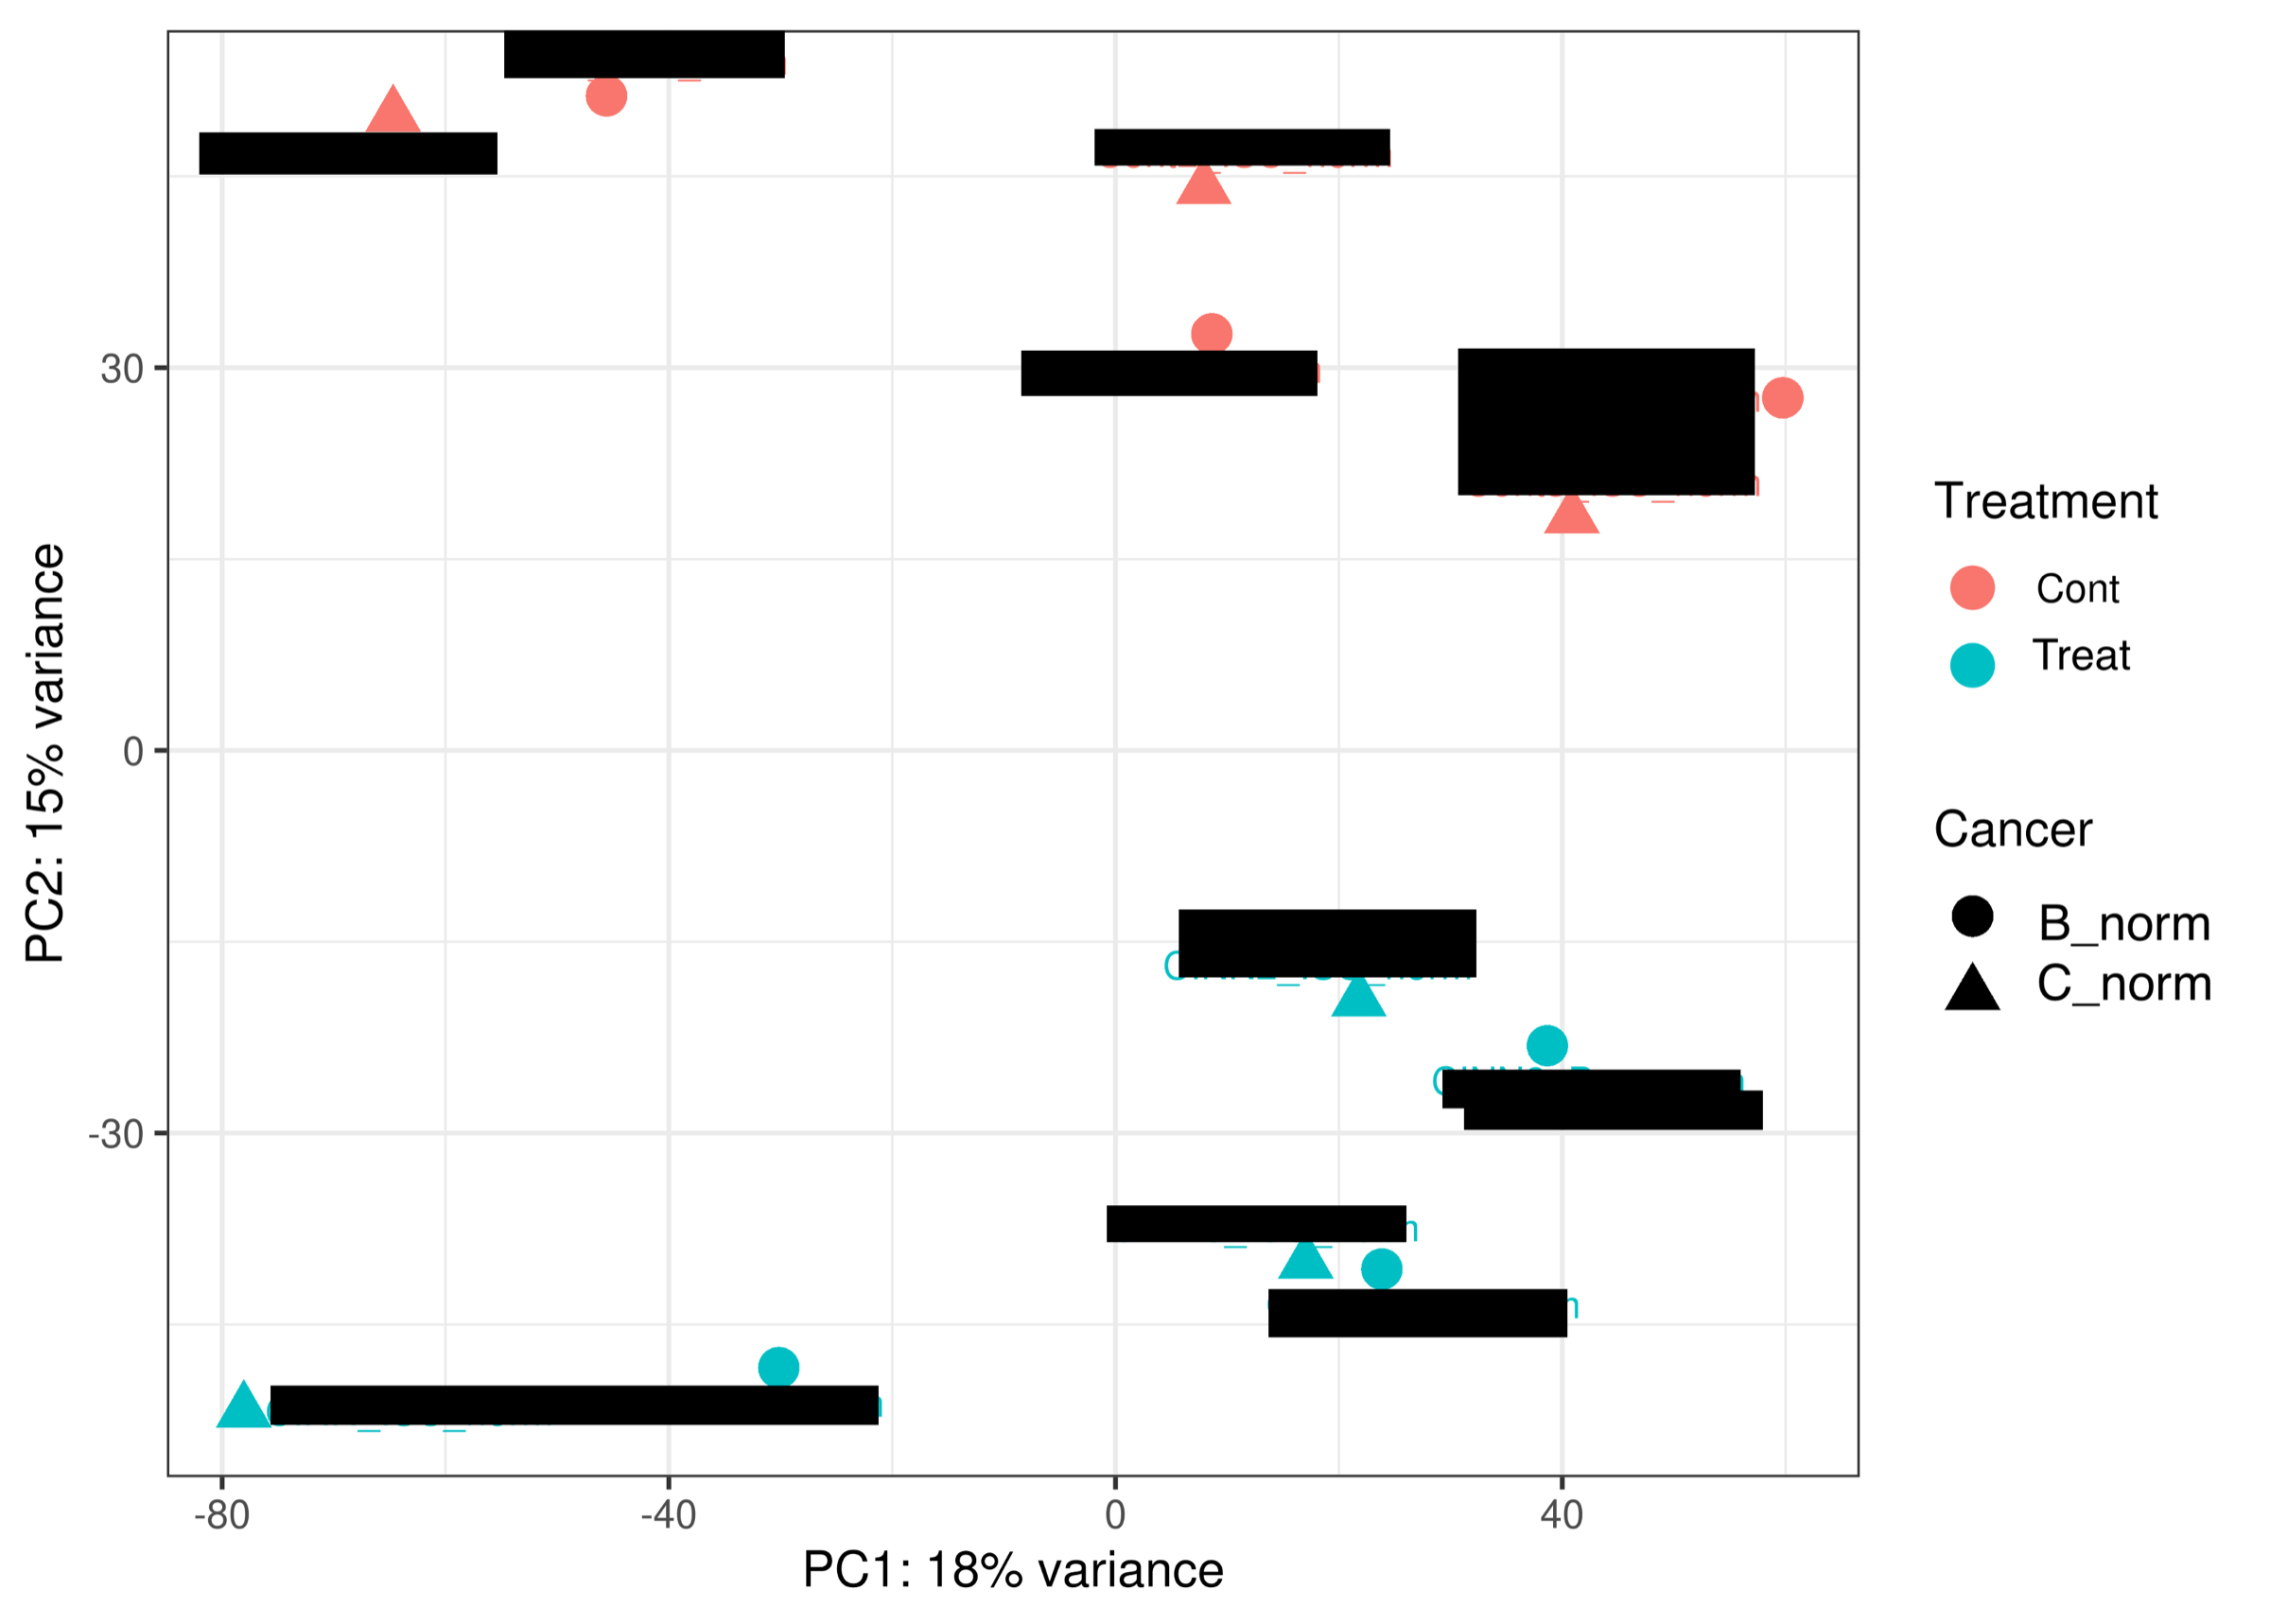
Download original image: Sample relationships after within-individual normalization
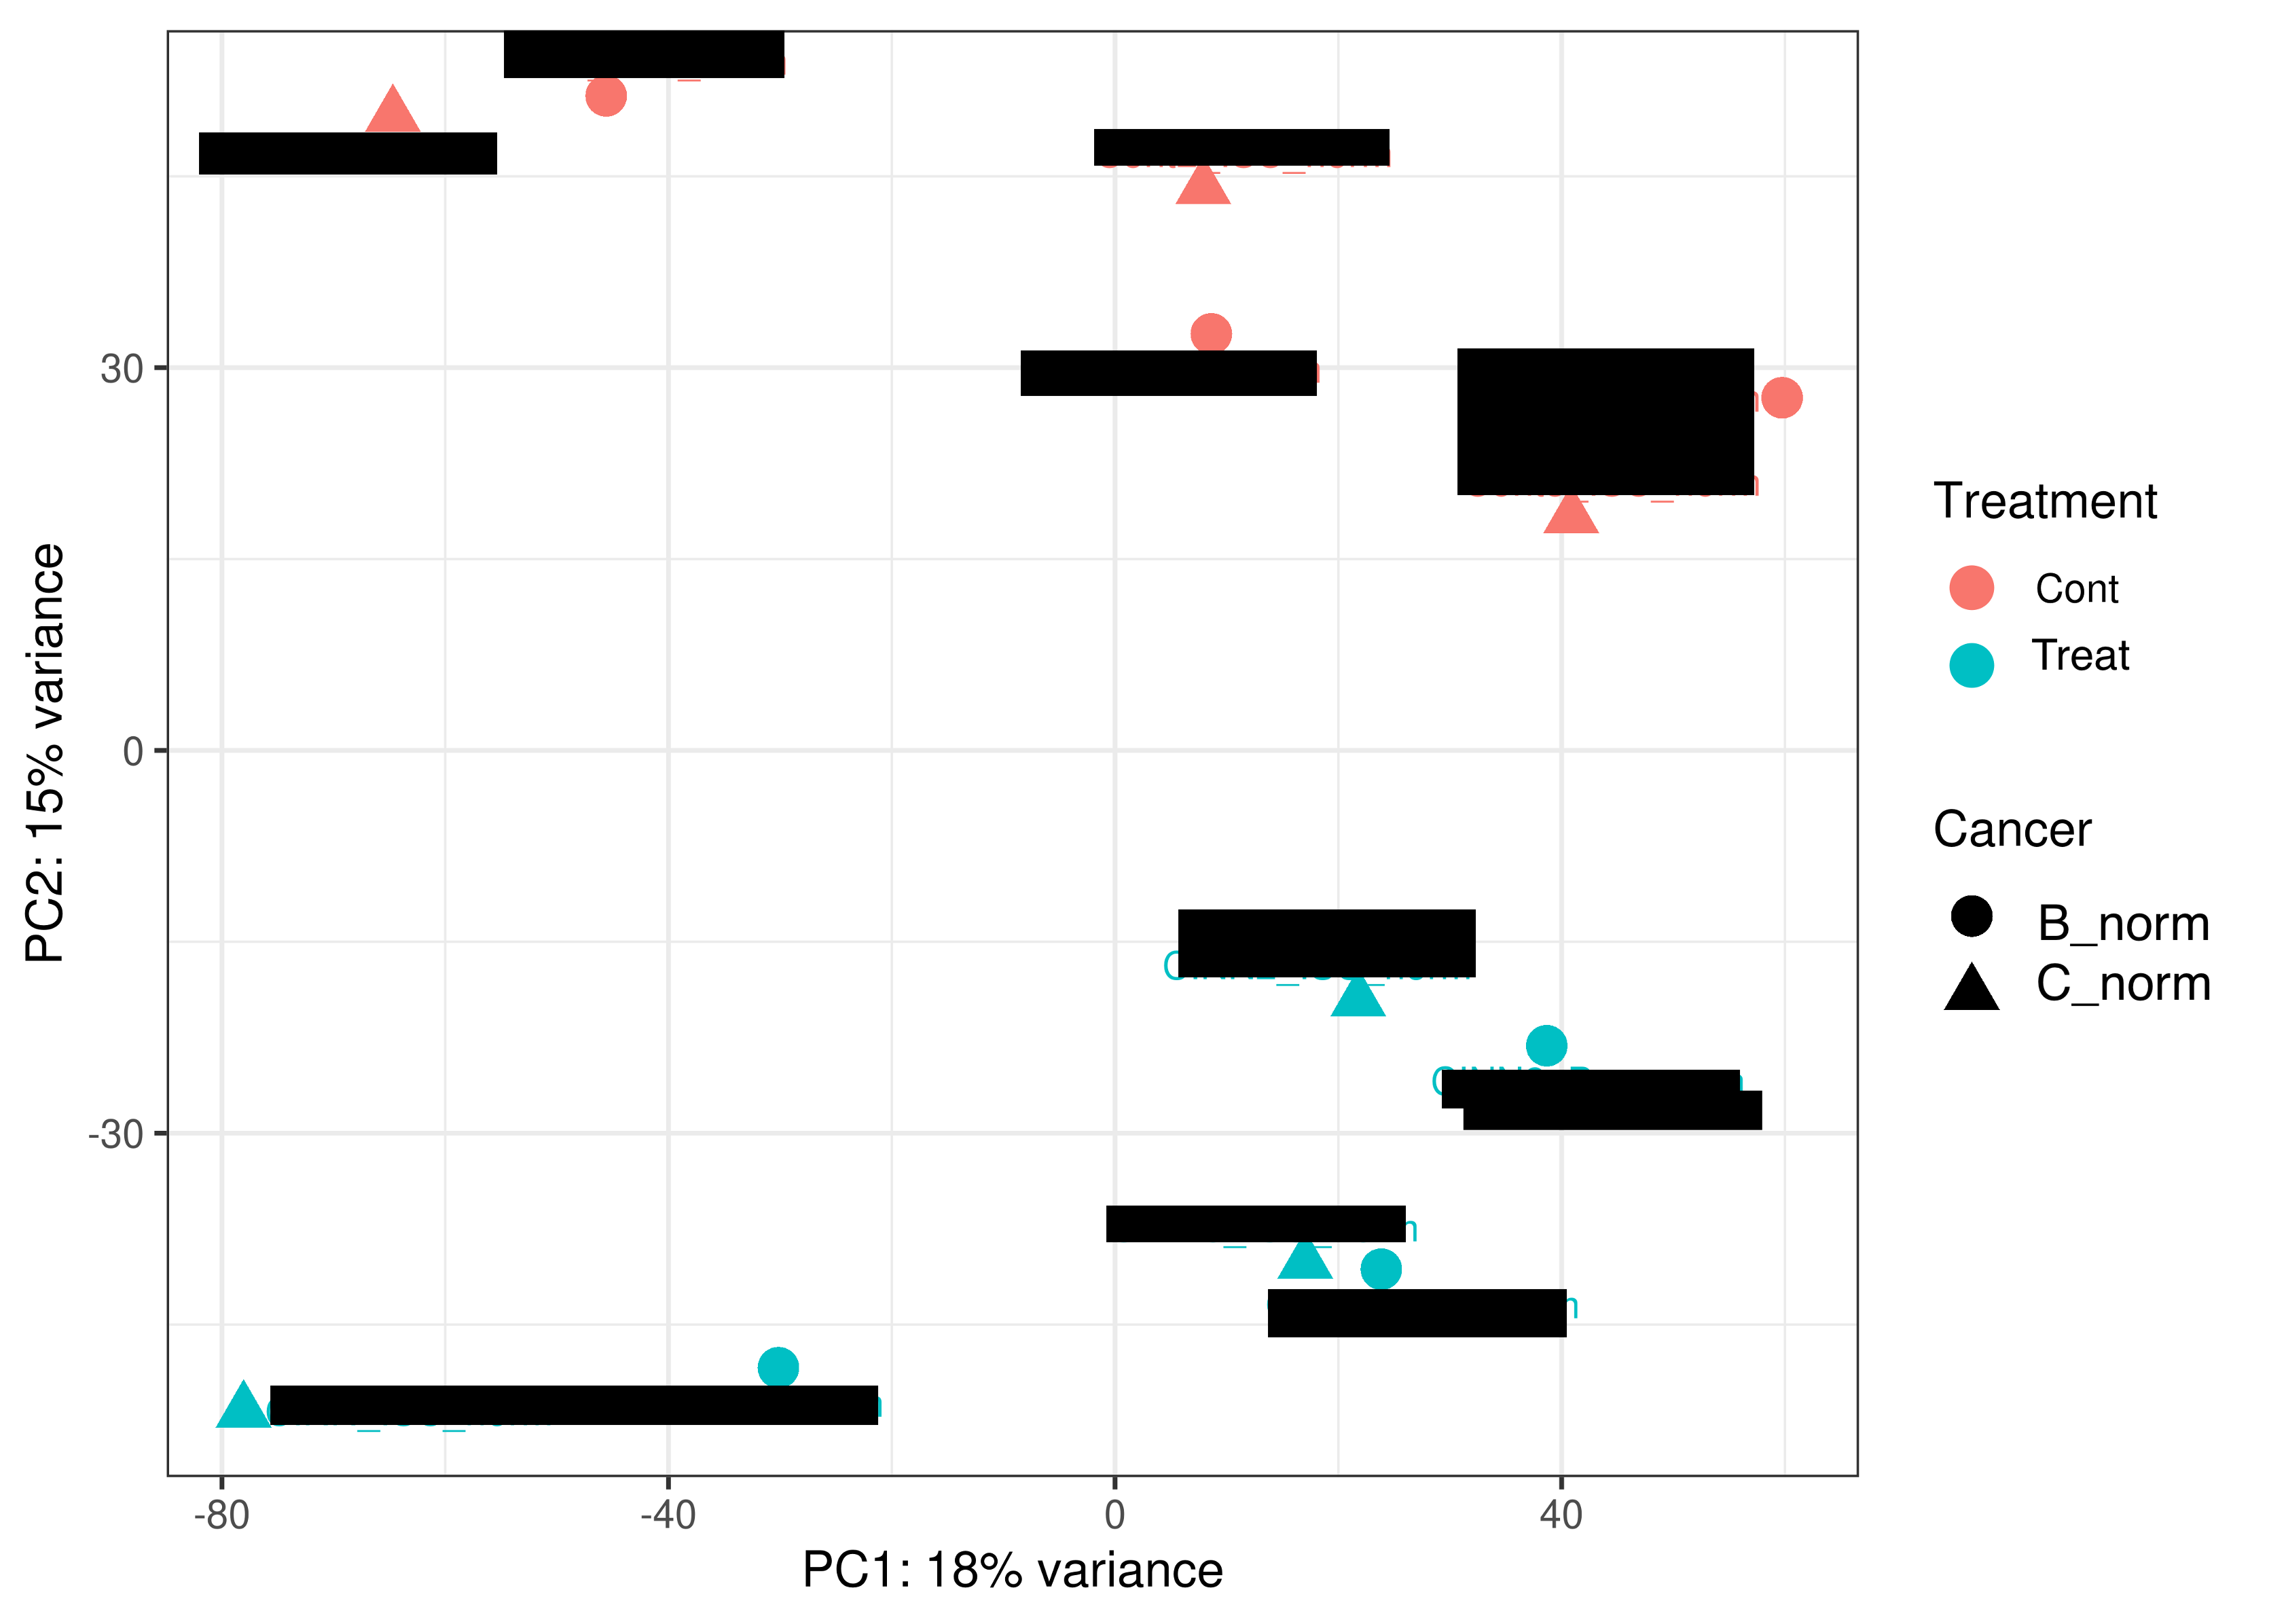
→ This method did a great job of separating Treatments of cancer B and C by mitigating the effects of individuals
duplicateCorrelation
-
Furthermore we considered the individual effect as gene expression of same individual must be similar → Cont_B_norm must be similar to Cont_C_norm, since they were all came from mouse 1.
-
Consider the interaction
~ Cancer*Treatment
DEG Result of Method 1
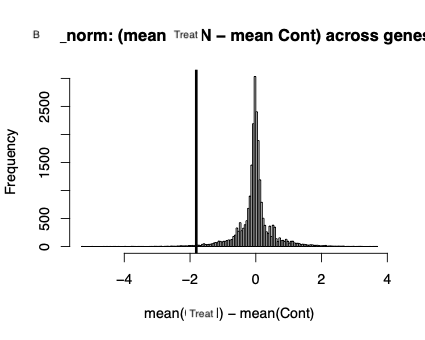
- Only 1 DEG (ENSRNOG00000006478) was found. Was it special?
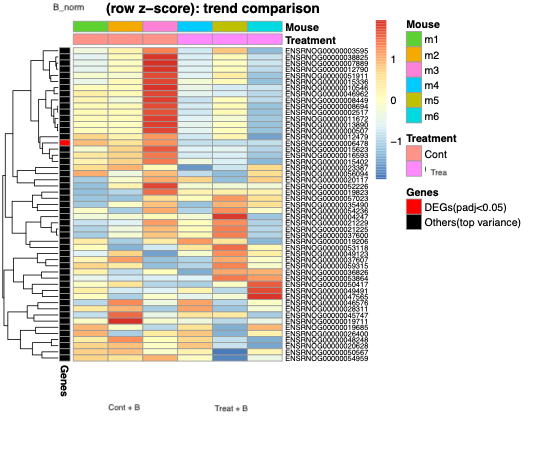
The trend of this DEG was down-regulated by the Treatment in cancer B?
- From the frequency histogram, we confirmed that such down-regulation trend was not common.
GSEA of Method 1
With few DEGs, I chose GSEA to highlight GO term instead of ORA.
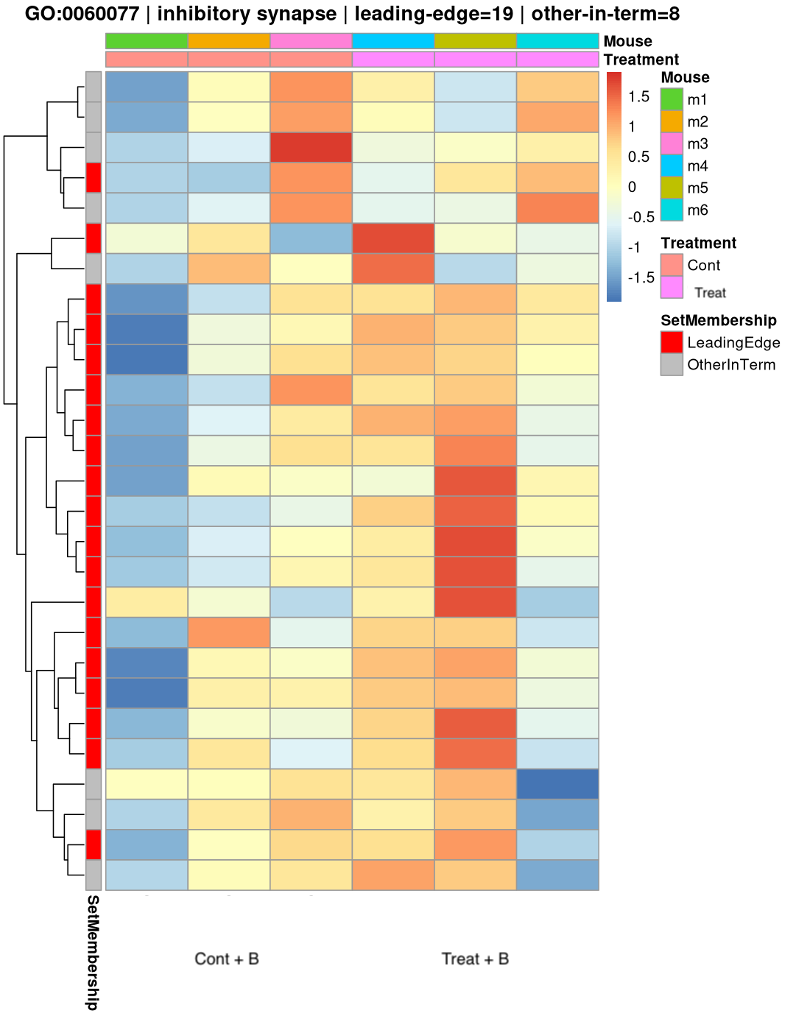
Among all NES>0 GO terms, we focused on this term (GO:0060077).
Sample-level
We calculated 2 kinds of score to quantify the activation of each sample in this term:
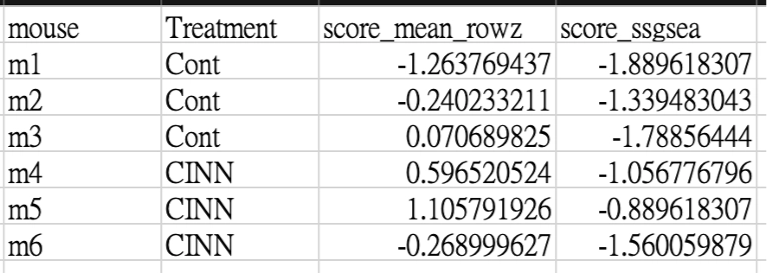
GO term - Samples
We calculated further 4 kinds of score to judge
- whether the significance we observed was real between treatment

For researcher, if not significant → this term might be hard to validate in the following experiment
Method 2: DREAM