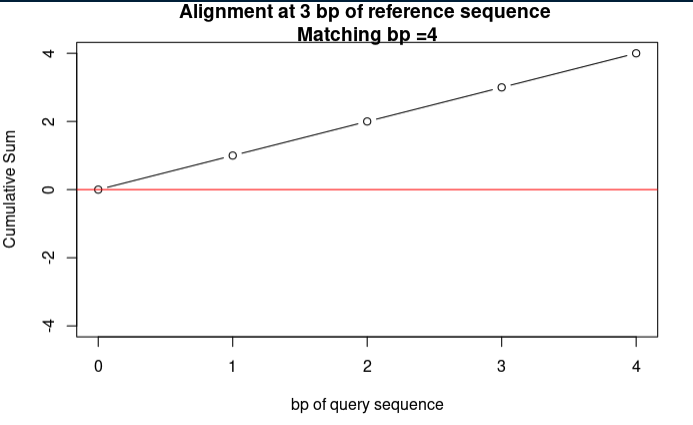
A programming exercise in finding an ungapped query match in a reference sequence. The name “Simple BLAST” describes the exercise; the code is a small sequence-matching routine rather than the full BLAST algorithm.
Question
Can I produce a simple BLAST function?
If I input the query sequence ATAC and the reference sequence GGATACTF, the function should output where the query sequence is optimally matched on the reference sequence.
Additional rules (which is why I called this “simple” BLAST):
- NO GAPS
Code
library(ggplot2)

# Create a matrix to store alignment scores
RS = c("GCGATC") # reference sequence
QS = c("GATC") # query sequence

for (k in 1:(nchar(RS)-nchar(QS)+1)){   # RS bp - QS bp + 1: how many types of alignments?

# START with the 1st alignment (no gaps)
# create matrix
  matching_score <- c()
  alignment_matrix <- matrix("", nrow = nchar(QS) + 1, ncol = nchar(RS) + 1)
    for (i in 1:nchar(QS)) {     # QS bp
    for (j in 1:nchar(RS)) {     # RS bp
          alignment_matrix[1, j+1] <- substr(RS, j, j)
          alignment_matrix[i+1, 1] <- substr(QS, i, i)
    }
    }

# assign matching scores in this matrix (how many scores = how long is the query sequence)AND
# input the matching scores for all alignments

				for (s in 1:nchar(QS)) {
          if (alignment_matrix[1, k+s] == alignment_matrix[s+1, 1]){
	            alignment_matrix[s+1, k+s] <- as.numeric(1)
          } else { alignment_matrix[s+1, k+s] <- as.numeric(-1) }

    # save these matching scores
    matching_score <- c(matching_score,
                        as.numeric(alignment_matrix[s+1, s+k]))

  }


# output everytime when a matrix is finished with scores assignment
    assign(paste0("matching_score","_",k),
           matching_score,
           envir=.GlobalEnv)

                              }


# visualization

matchingScore <- c()
for (i in 1:(nchar(RS)-nchar(QS)+1)){

      # calculate how many "1" are there
      matchingScore[[i]] <- sum(mget(paste0("matching_score_", i))[[1]] == 1)
}


      matchingScore_value <- max(unlist(matchingScore))
      matchingScore_start <- which(unlist(matchingScore) == matchingScore_value)


# Calculate cumulative sum
cumulative_sum <- cumsum(c(0, as.numeric(
                                    mget(
                                          paste0("matching_score_", matchingScore_start))[[1]]
                                    )))  # Add a 0 at the beginning

# Create an index vector (x-axis values starting with 0)
indices <- seq_along(cumulative_sum) - 1  # Subtract 1 to start with index 0

# Plot the line chart
plot(indices,
            cumulative_sum,
            main = paste0("Alignment at ",matchingScore_start, " bp of reference sequence \nMatching bp =", matchingScore_value),
            type = "b",
            xlab = "bp of query sequence",
            ylab = "Cumulative Sum",
            ylim = c(-nchar(QS),
                     nchar(QS)))
abline(h=0, col="red")