Materials and Methods
1. Genes with similar expression in LNCaPMDVR and NCIH660, but different expression in LNCaP
Overview
The aim was to identify genes with similar expression in LNCaPMDVR and NCIH660 but a distinct expression pattern in LNCaP. I fitted the raw RNA-seq count matrix with DESeq2, using LNCaP, LNCaPMDVR, and NCIH660 as the sample groups. LNCaPMDVR was the reference level, and the model design was ~ group + batch. The threshold-based tests therefore assessed group differences after accounting for batch effects. Visualization and clustering used DESeq2-normalized gene expression followed by a variance stabilizing transformation (VST).
Defining similar expression in LNCaPMDVR and NCIH660
(a) I used a DESeq2 threshold-based test for the NCIH660-versus-LNCaPMDVR log2 fold change, with lfcThreshold = 2 and altHypothesis = "lessAbs". Genes with adjusted p-value < 0.05 were selected as having statistically supported expression similarity within the tested bound. Threshold clarification: the method notes specify a parameter of 2 but describe the null and alternative hypotheses using an absolute log2 fold-change bound of 3. This numerical inconsistency needs reconciliation with the analysis script before reproducing the selection.
Defining different expression in LNCaP
(b) To identify genes whose expression in LNCaP differed from the average of LNCaPMDVR and NCIH660, I constructed this contrast:
LNCaP − (LNCaPMDVR + NCIH660) / 2
In DESeq2, the comparison was specified by a named contrast vector matching resultsNames(dds). Batch coefficients were set to 0. The group coefficients were group_NCIH660_vs_LNCaPMDVR = -0.5 and group_LNCaP_vs_LNCaPMDVR = 1, testing LNCaP against the average expression of the other two groups. The specified test used lfcThreshold = 2 and altHypothesis = "greaterAbs"; genes with adjusted p-value < 0.05 were selected as significantly different. Threshold clarification: the accompanying hypothesis description uses an absolute log2 fold-change bound of 1, although the parameter is recorded as 2. The exact bound also requires reconciliation with the script.
I intersected the two selected gene sets to find genes that satisfied both conditions: supported similarity between LNCaPMDVR and NCIH660, and a difference between LNCaP and their average. The analysis produced 91 candidate genes for expression-trend analysis and functional enrichment.
Choosing lfcThreshold
The log2 fold-change thresholds were chosen for the research question. For the similarity test, a smaller threshold imposes a tighter definition of similar expression. For the difference test, a larger threshold requires a stronger departure in LNCaP. Overly strict bounds may leave too few genes in the intersection, or none. Both tests are recorded with lfcThreshold = 2, balancing biological interpretability against the number of genes available for analysis, subject to the numerical clarification above.
Clustering, ORA-GO
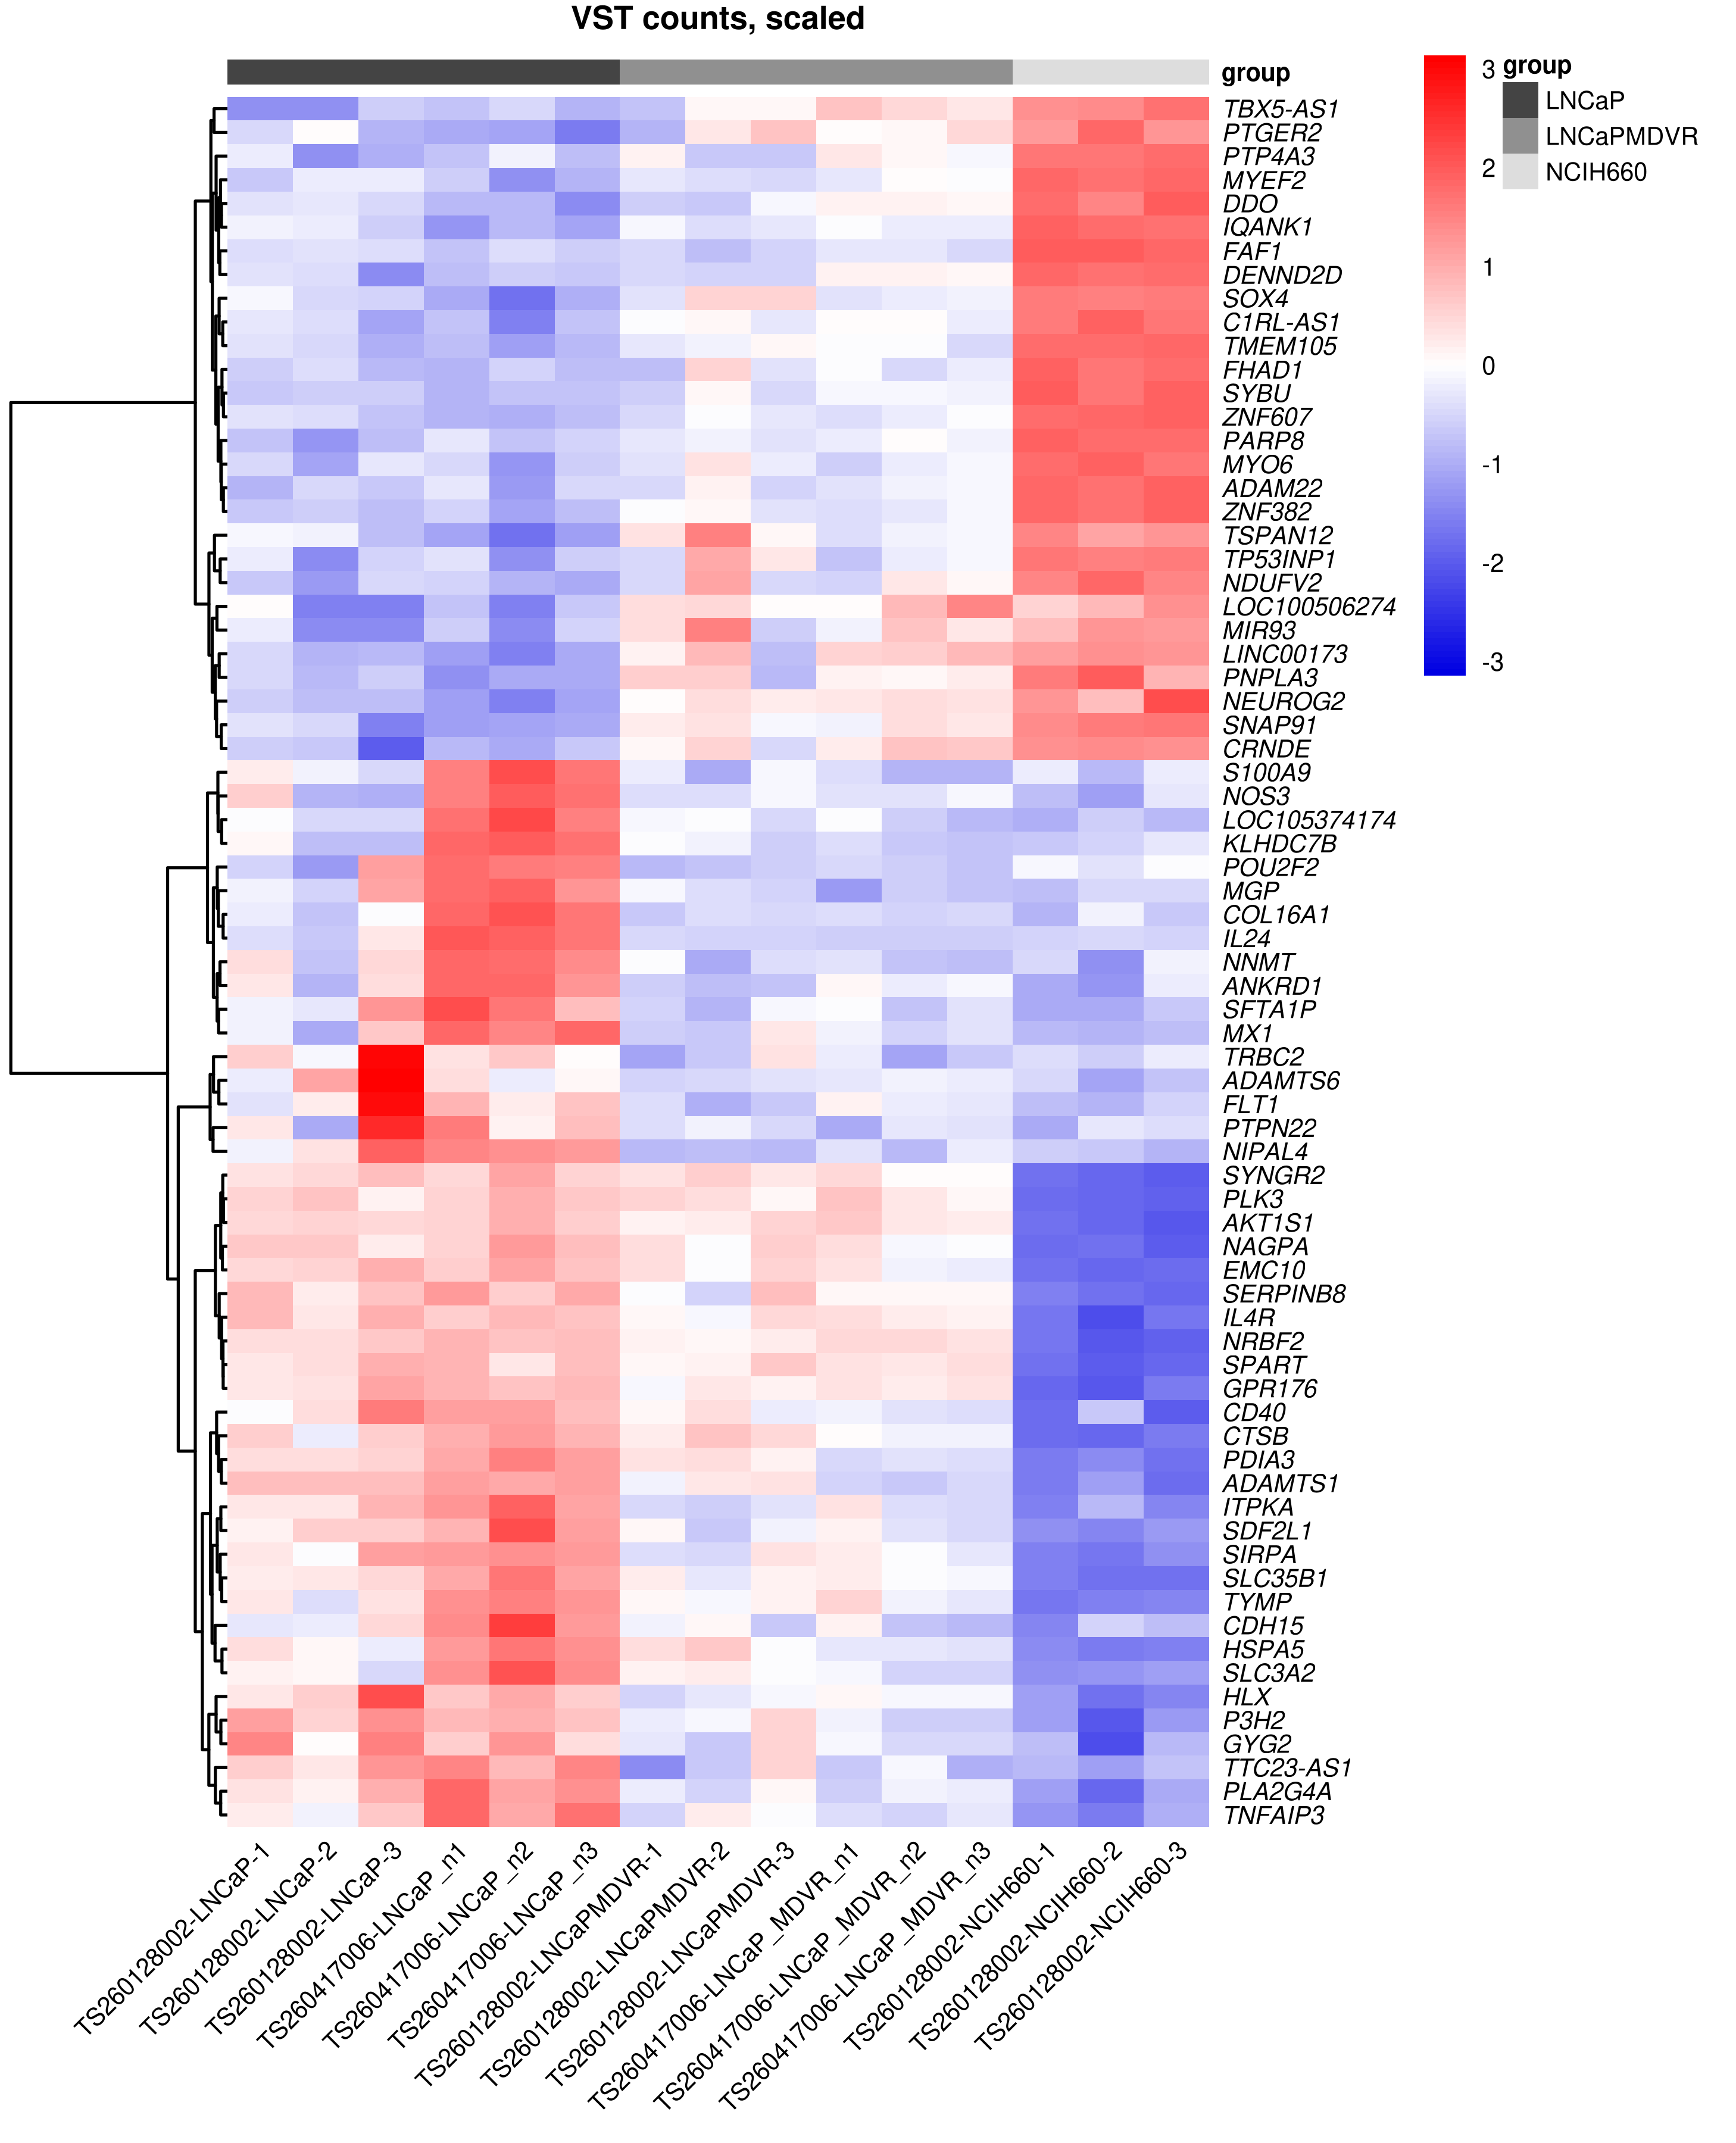
I clustered the VST-transformed expression matrix for the 91 candidate genes to examine patterns across LNCaP, LNCaPMDVR, and NCIH660. The genes formed two main clusters. Expression-profile line plots show the direction and magnitude of each cluster’s expression changes across the cell lines. I performed Gene Ontology (GO) over-representation analysis (ORA) separately for the two clusters, considering biological process, molecular function, and cellular component categories. The background consisted of genes that passed the expression-analysis workflow and could be annotated.
(a) Genes passing the p < 0.05 criterion
“Requirement_1/filteredSig_LNCaPMDVR_vs_NCIH660_close.csv”
(b) Genes passing the p < 0.05 criterion
“Requirement_1/filteredSig_LNCaP_vs_LNCaPMDVR.NCIH660.mean.csv”
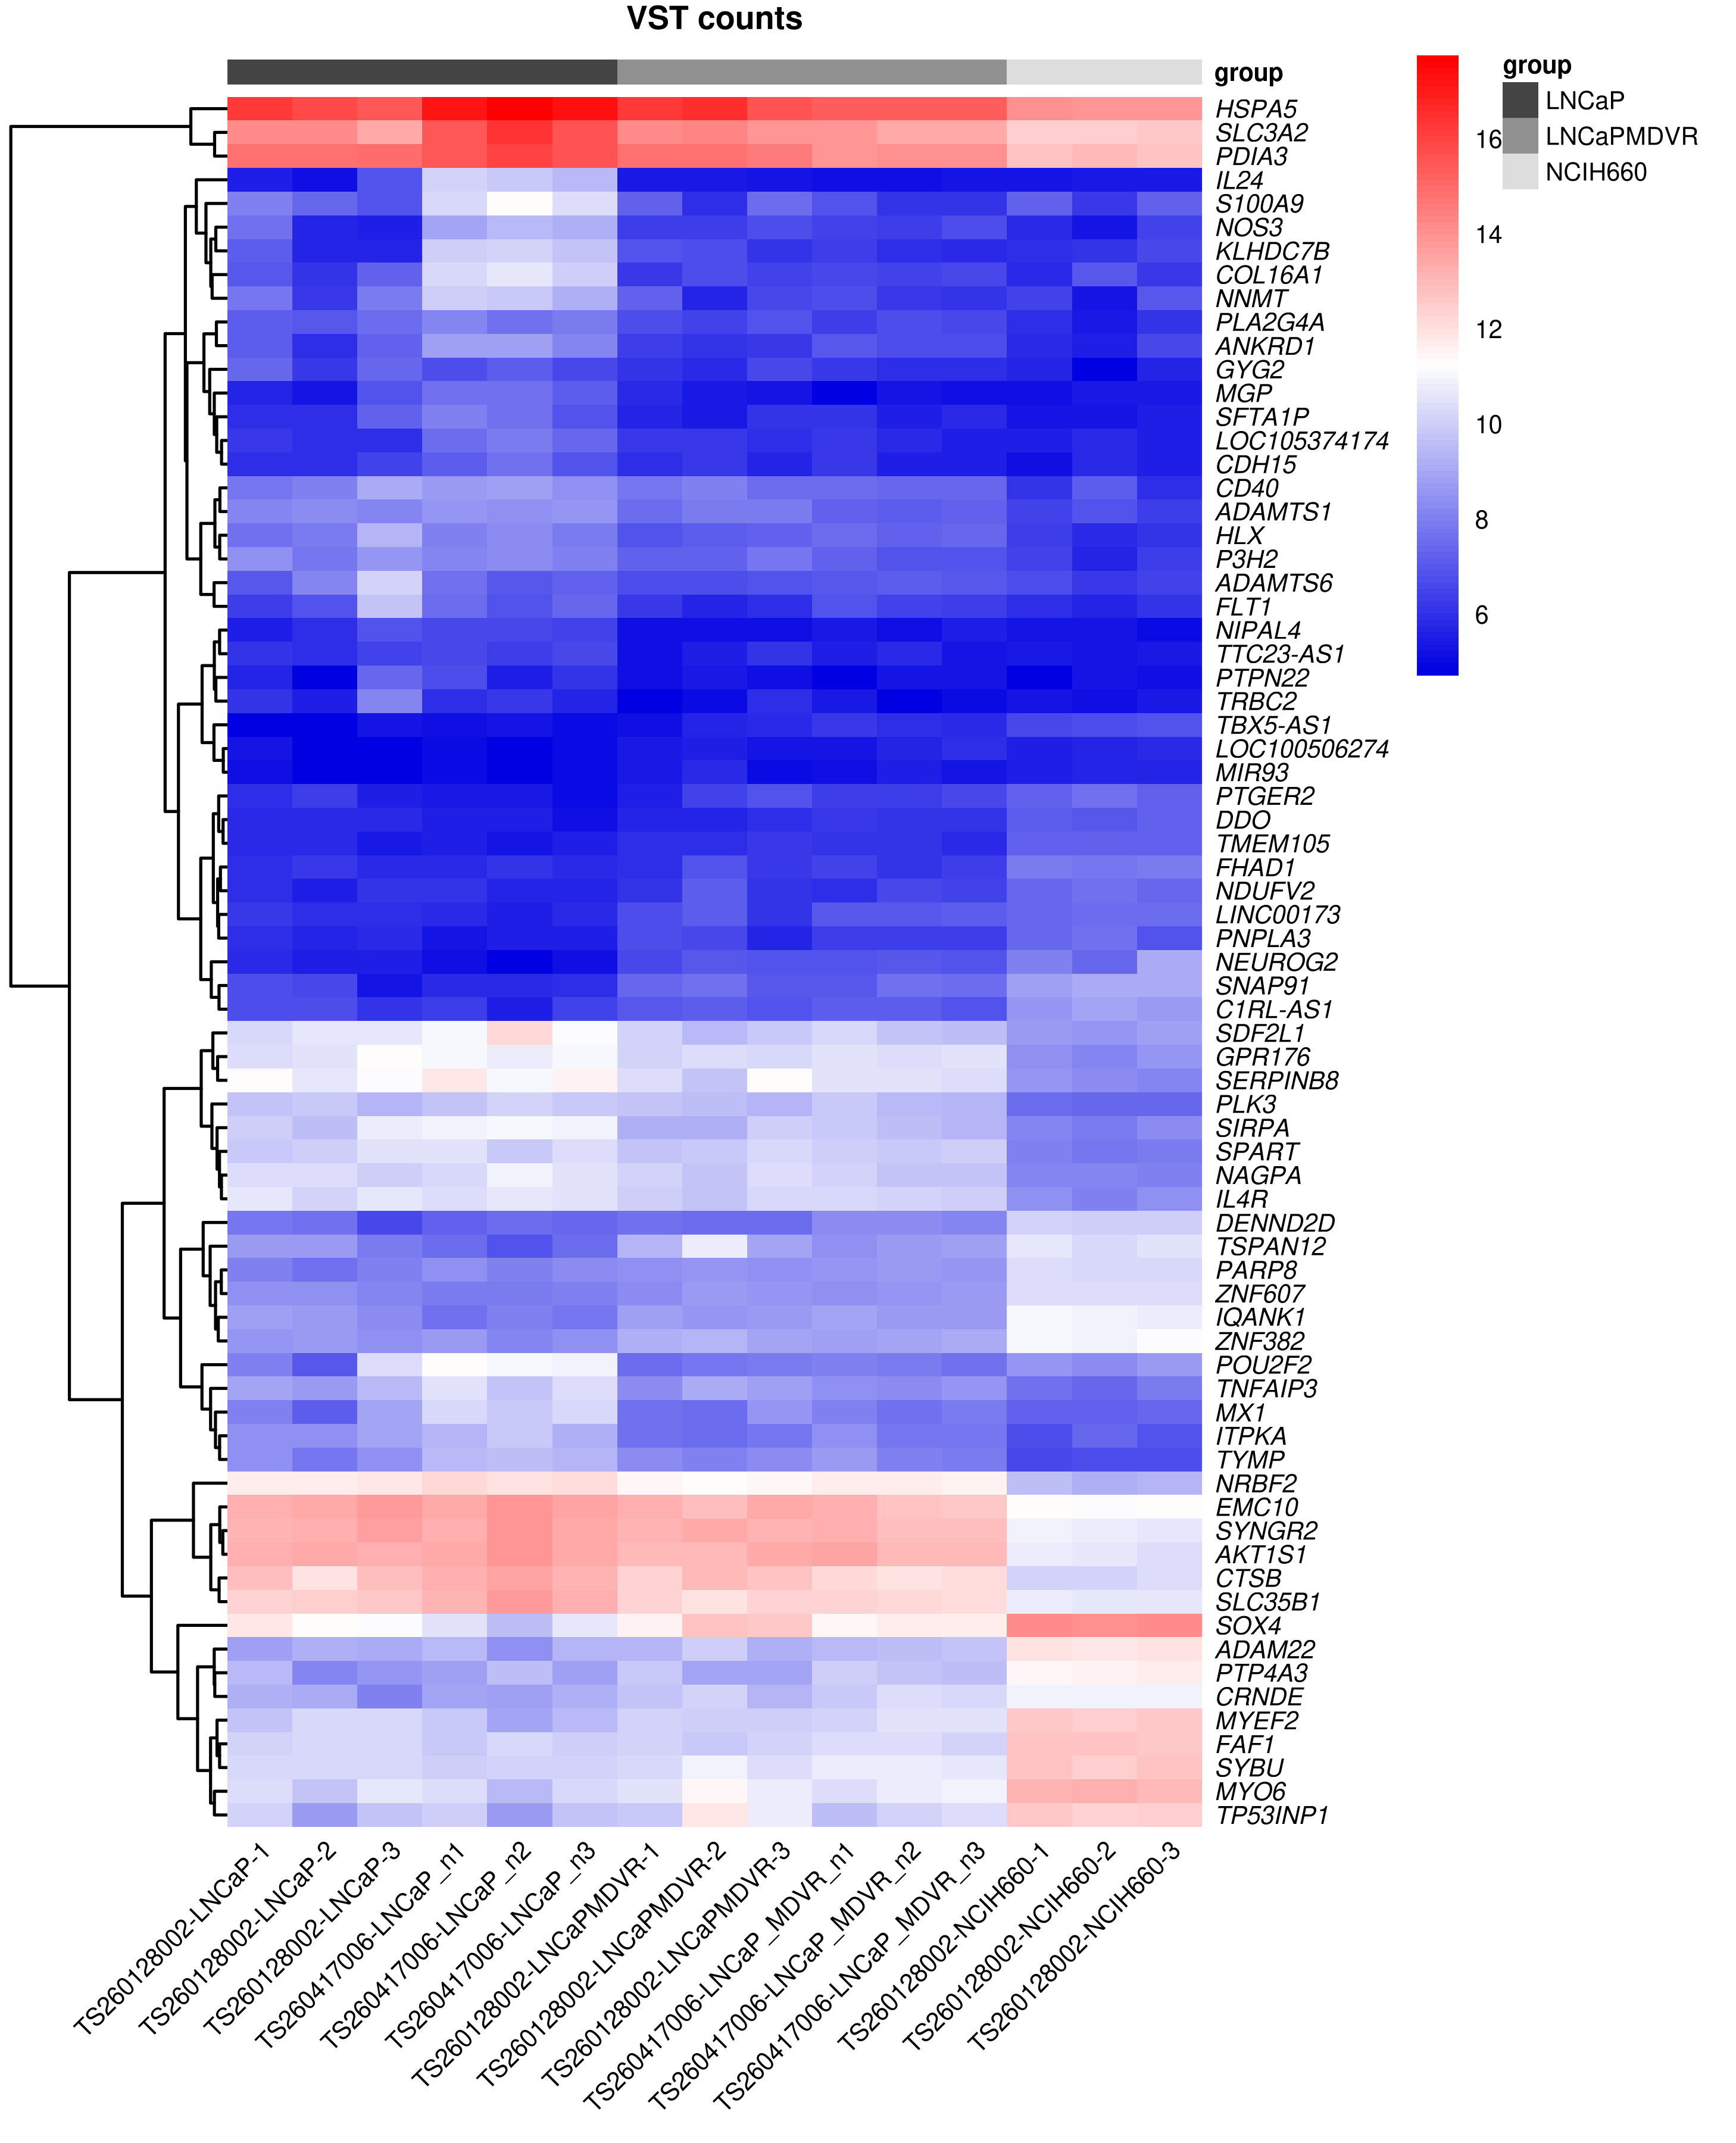
Heatmaps of the intersected genes
“Requirement_1/Heatmap.png”
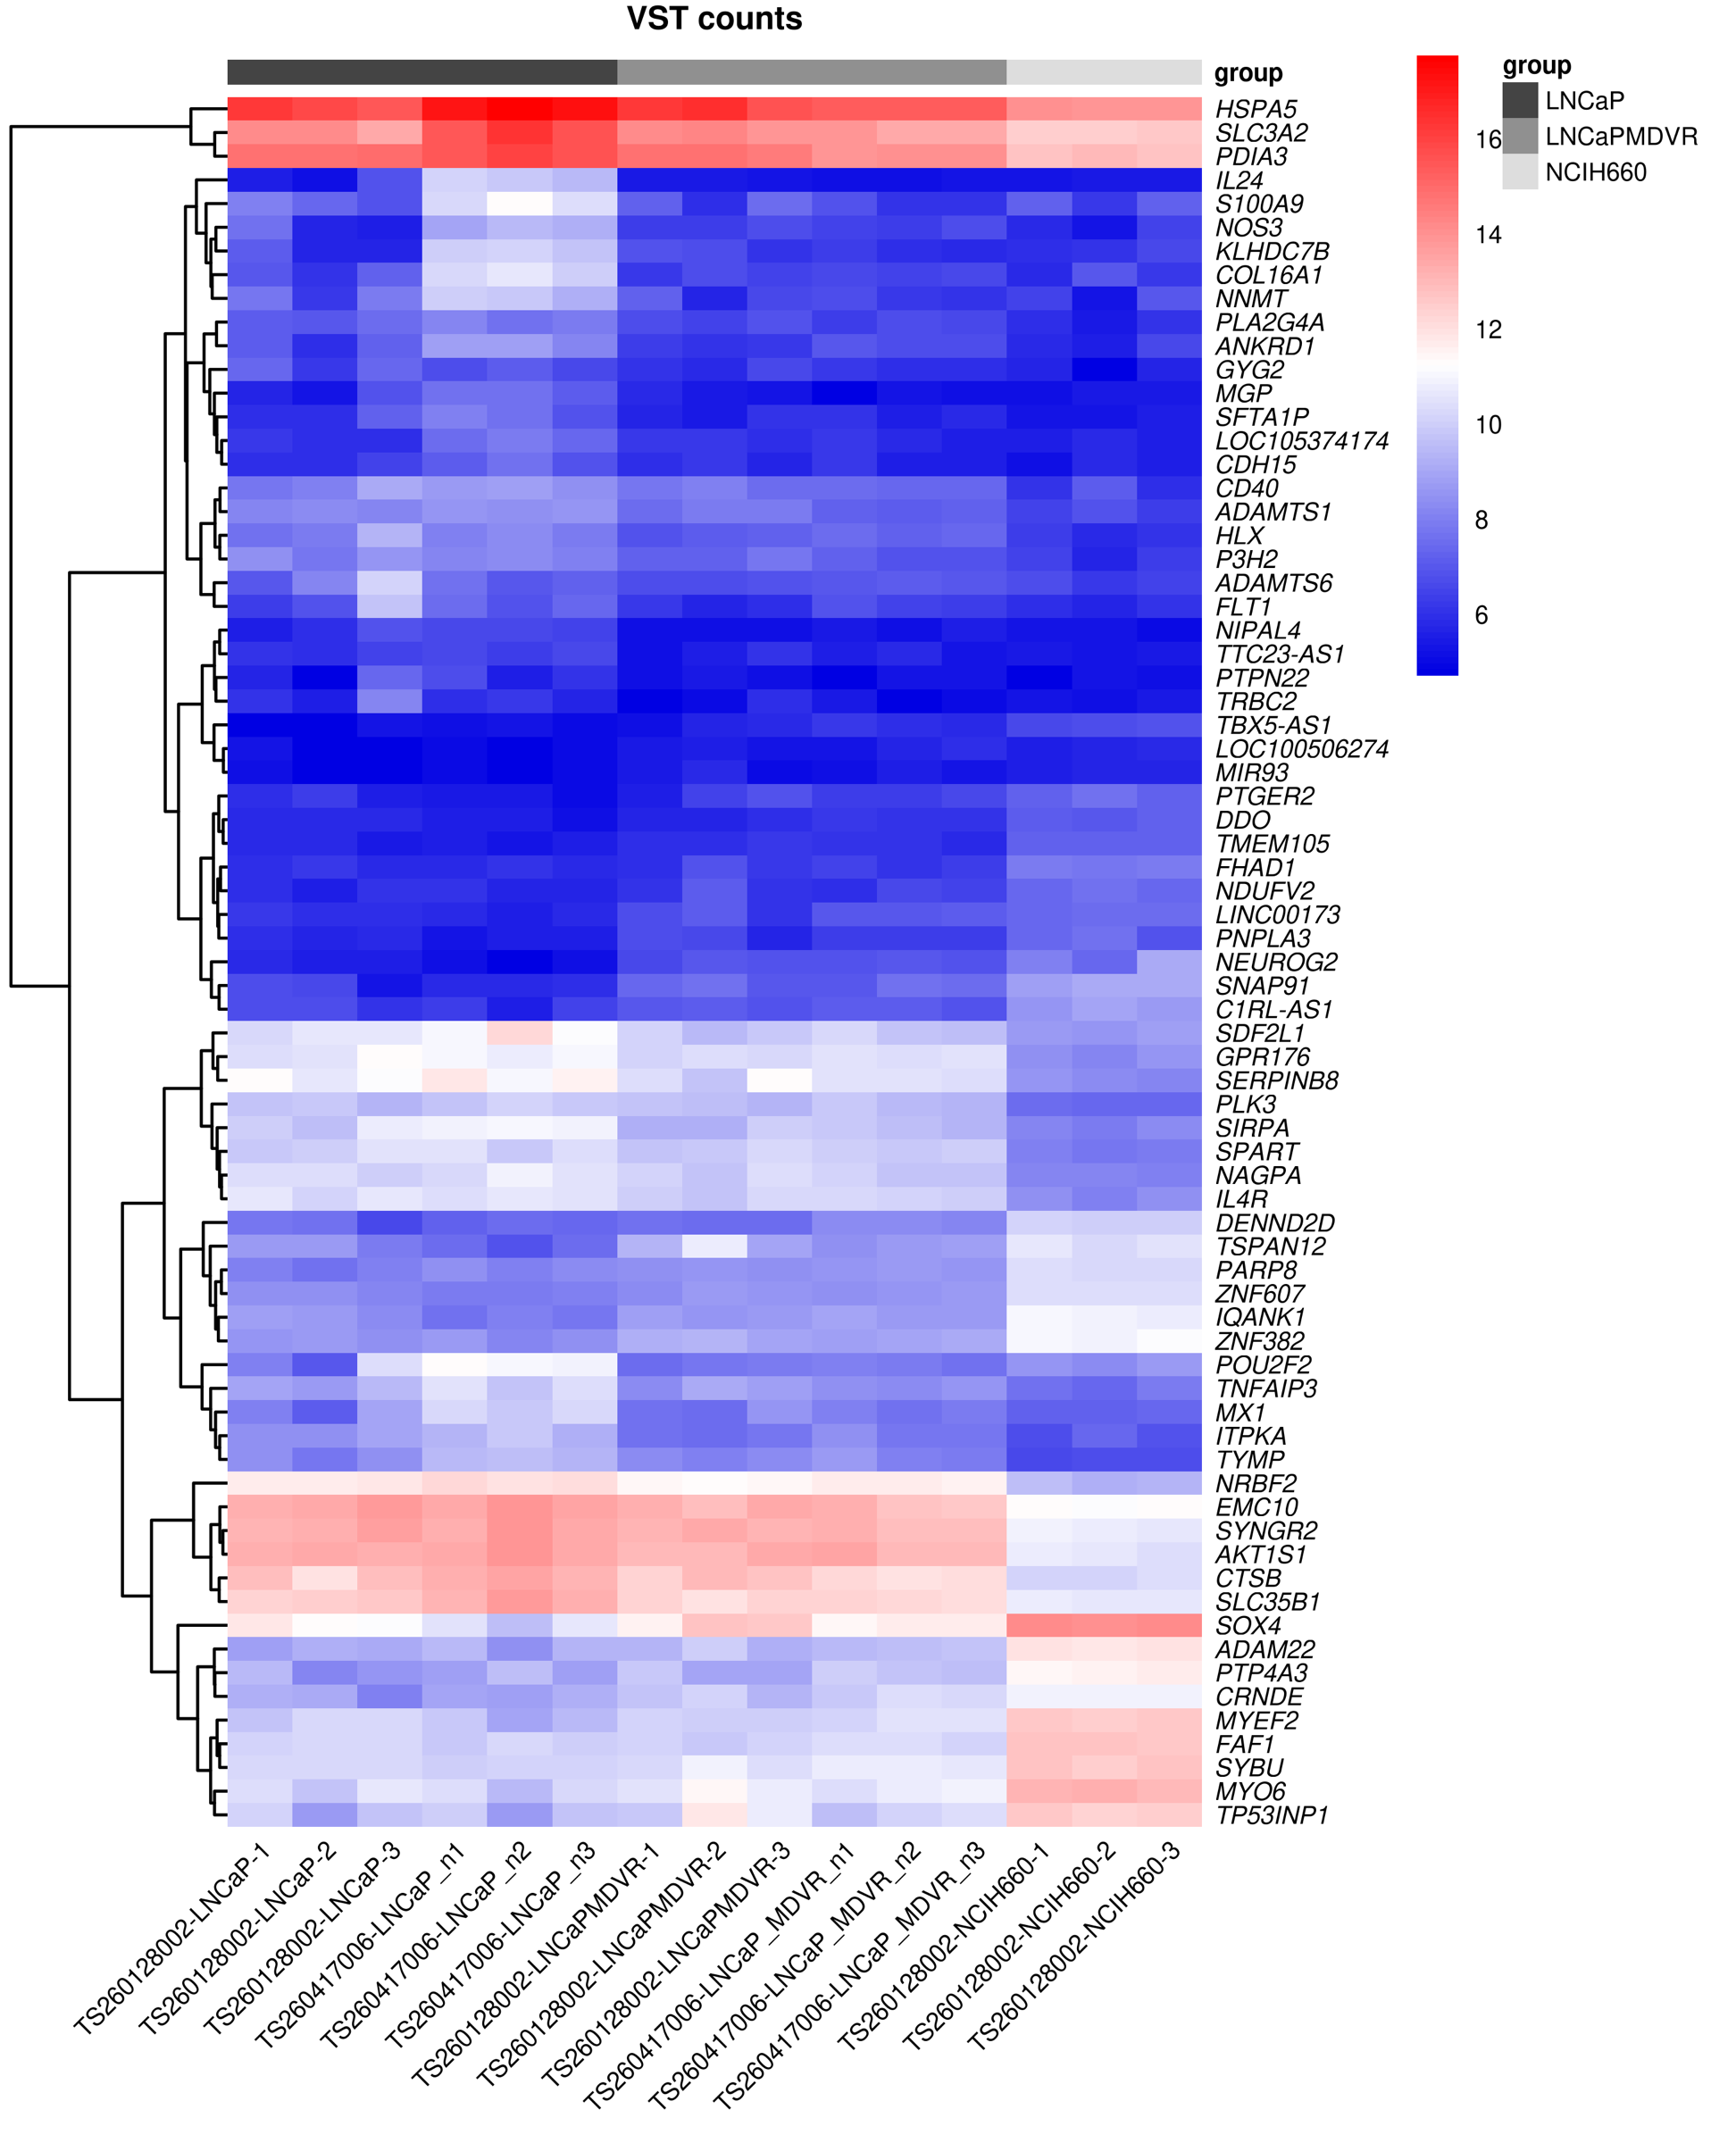
Download original image: Target-gene expression heatmap
“Requirement_1/Heatmap_scaled.png”
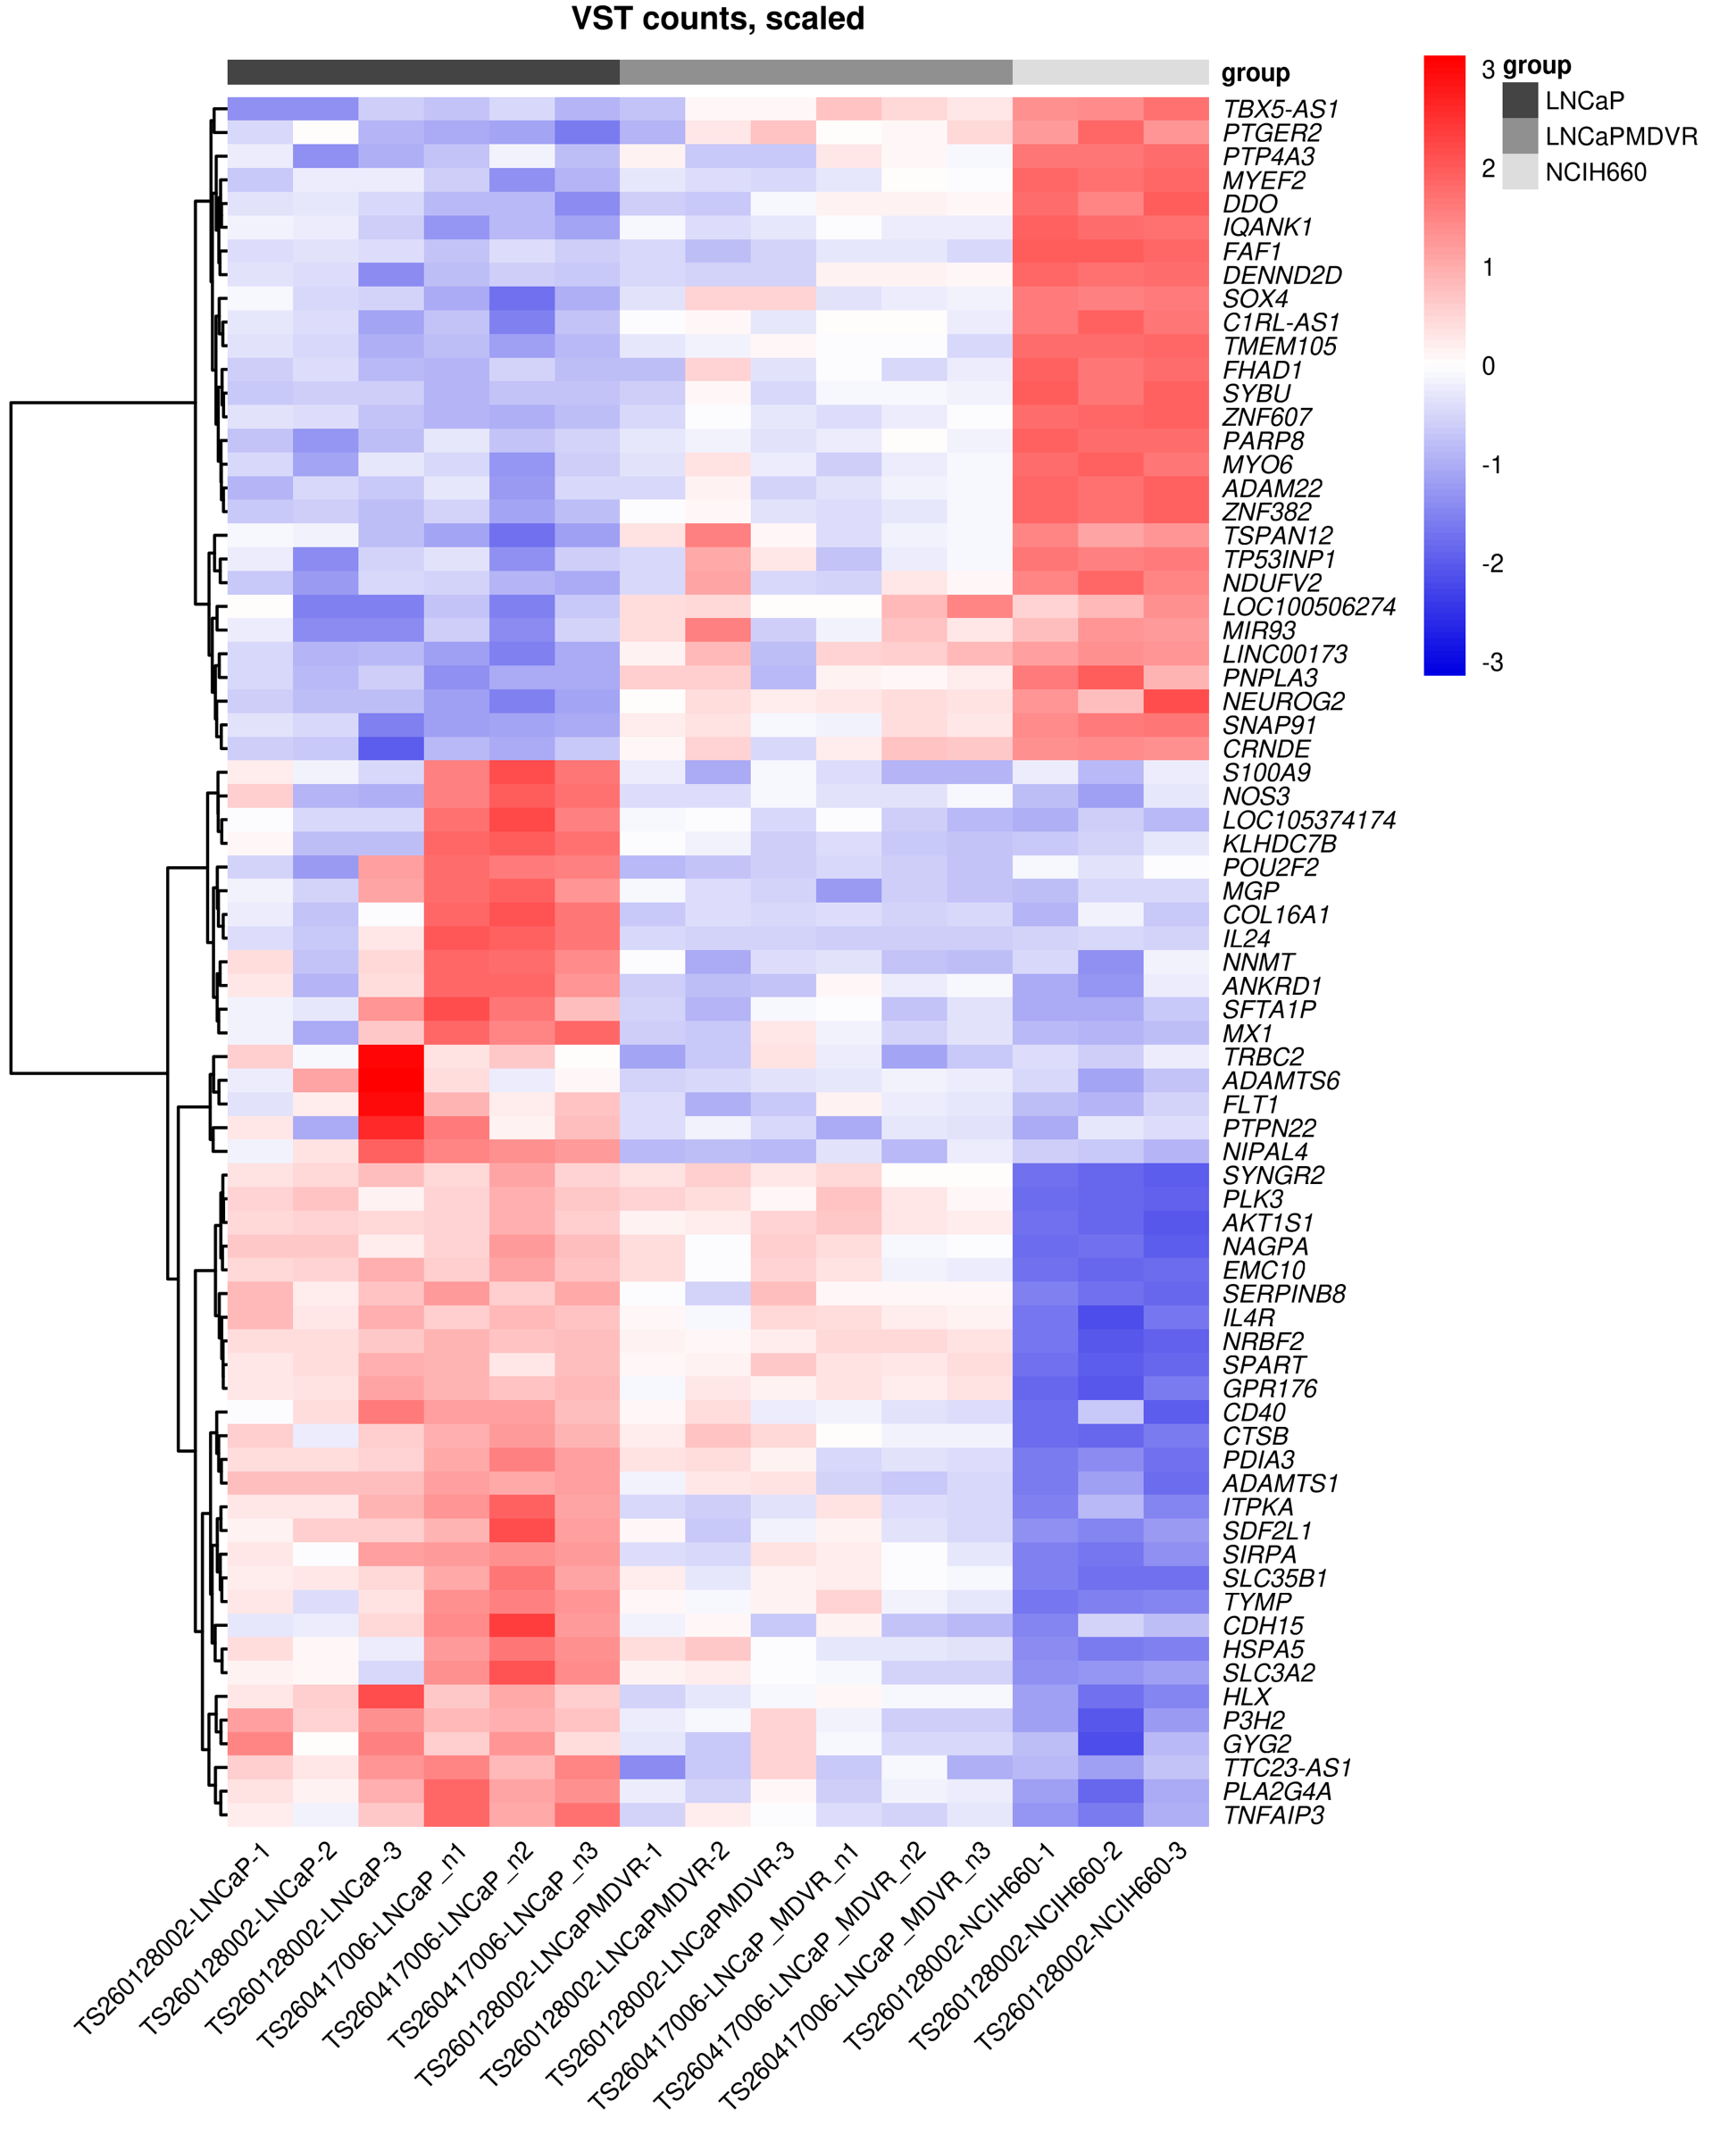
Download original image: Row-scaled target-gene expression heatmap
Expression profiles
“Requirement_1/Profile_scaled_2clusters.png”
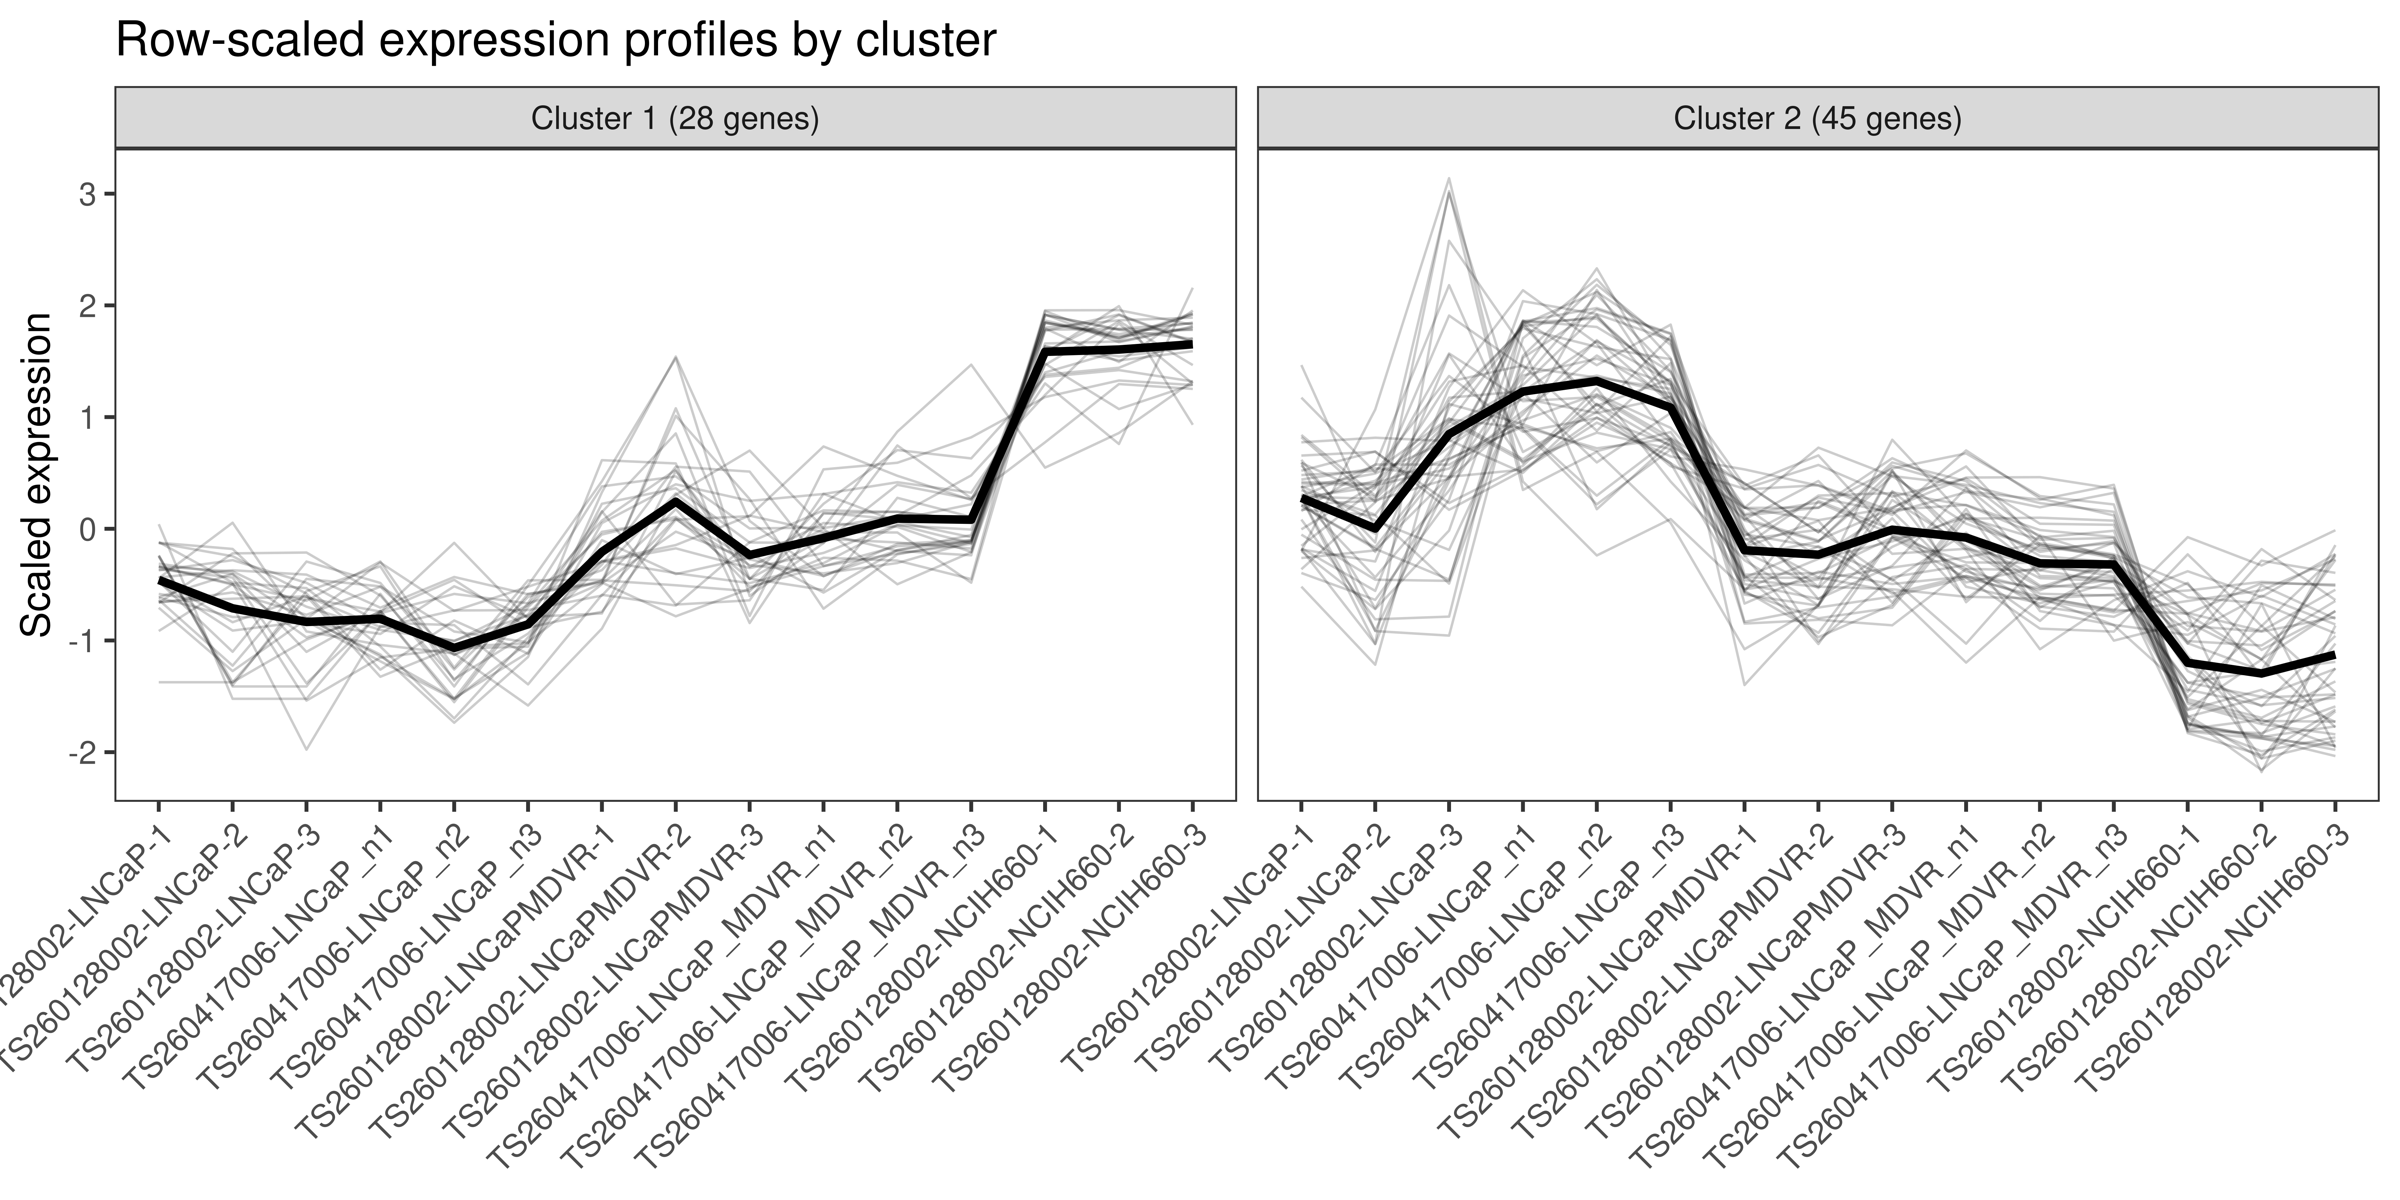
Download original image: Expression profiles for the two gene clusters
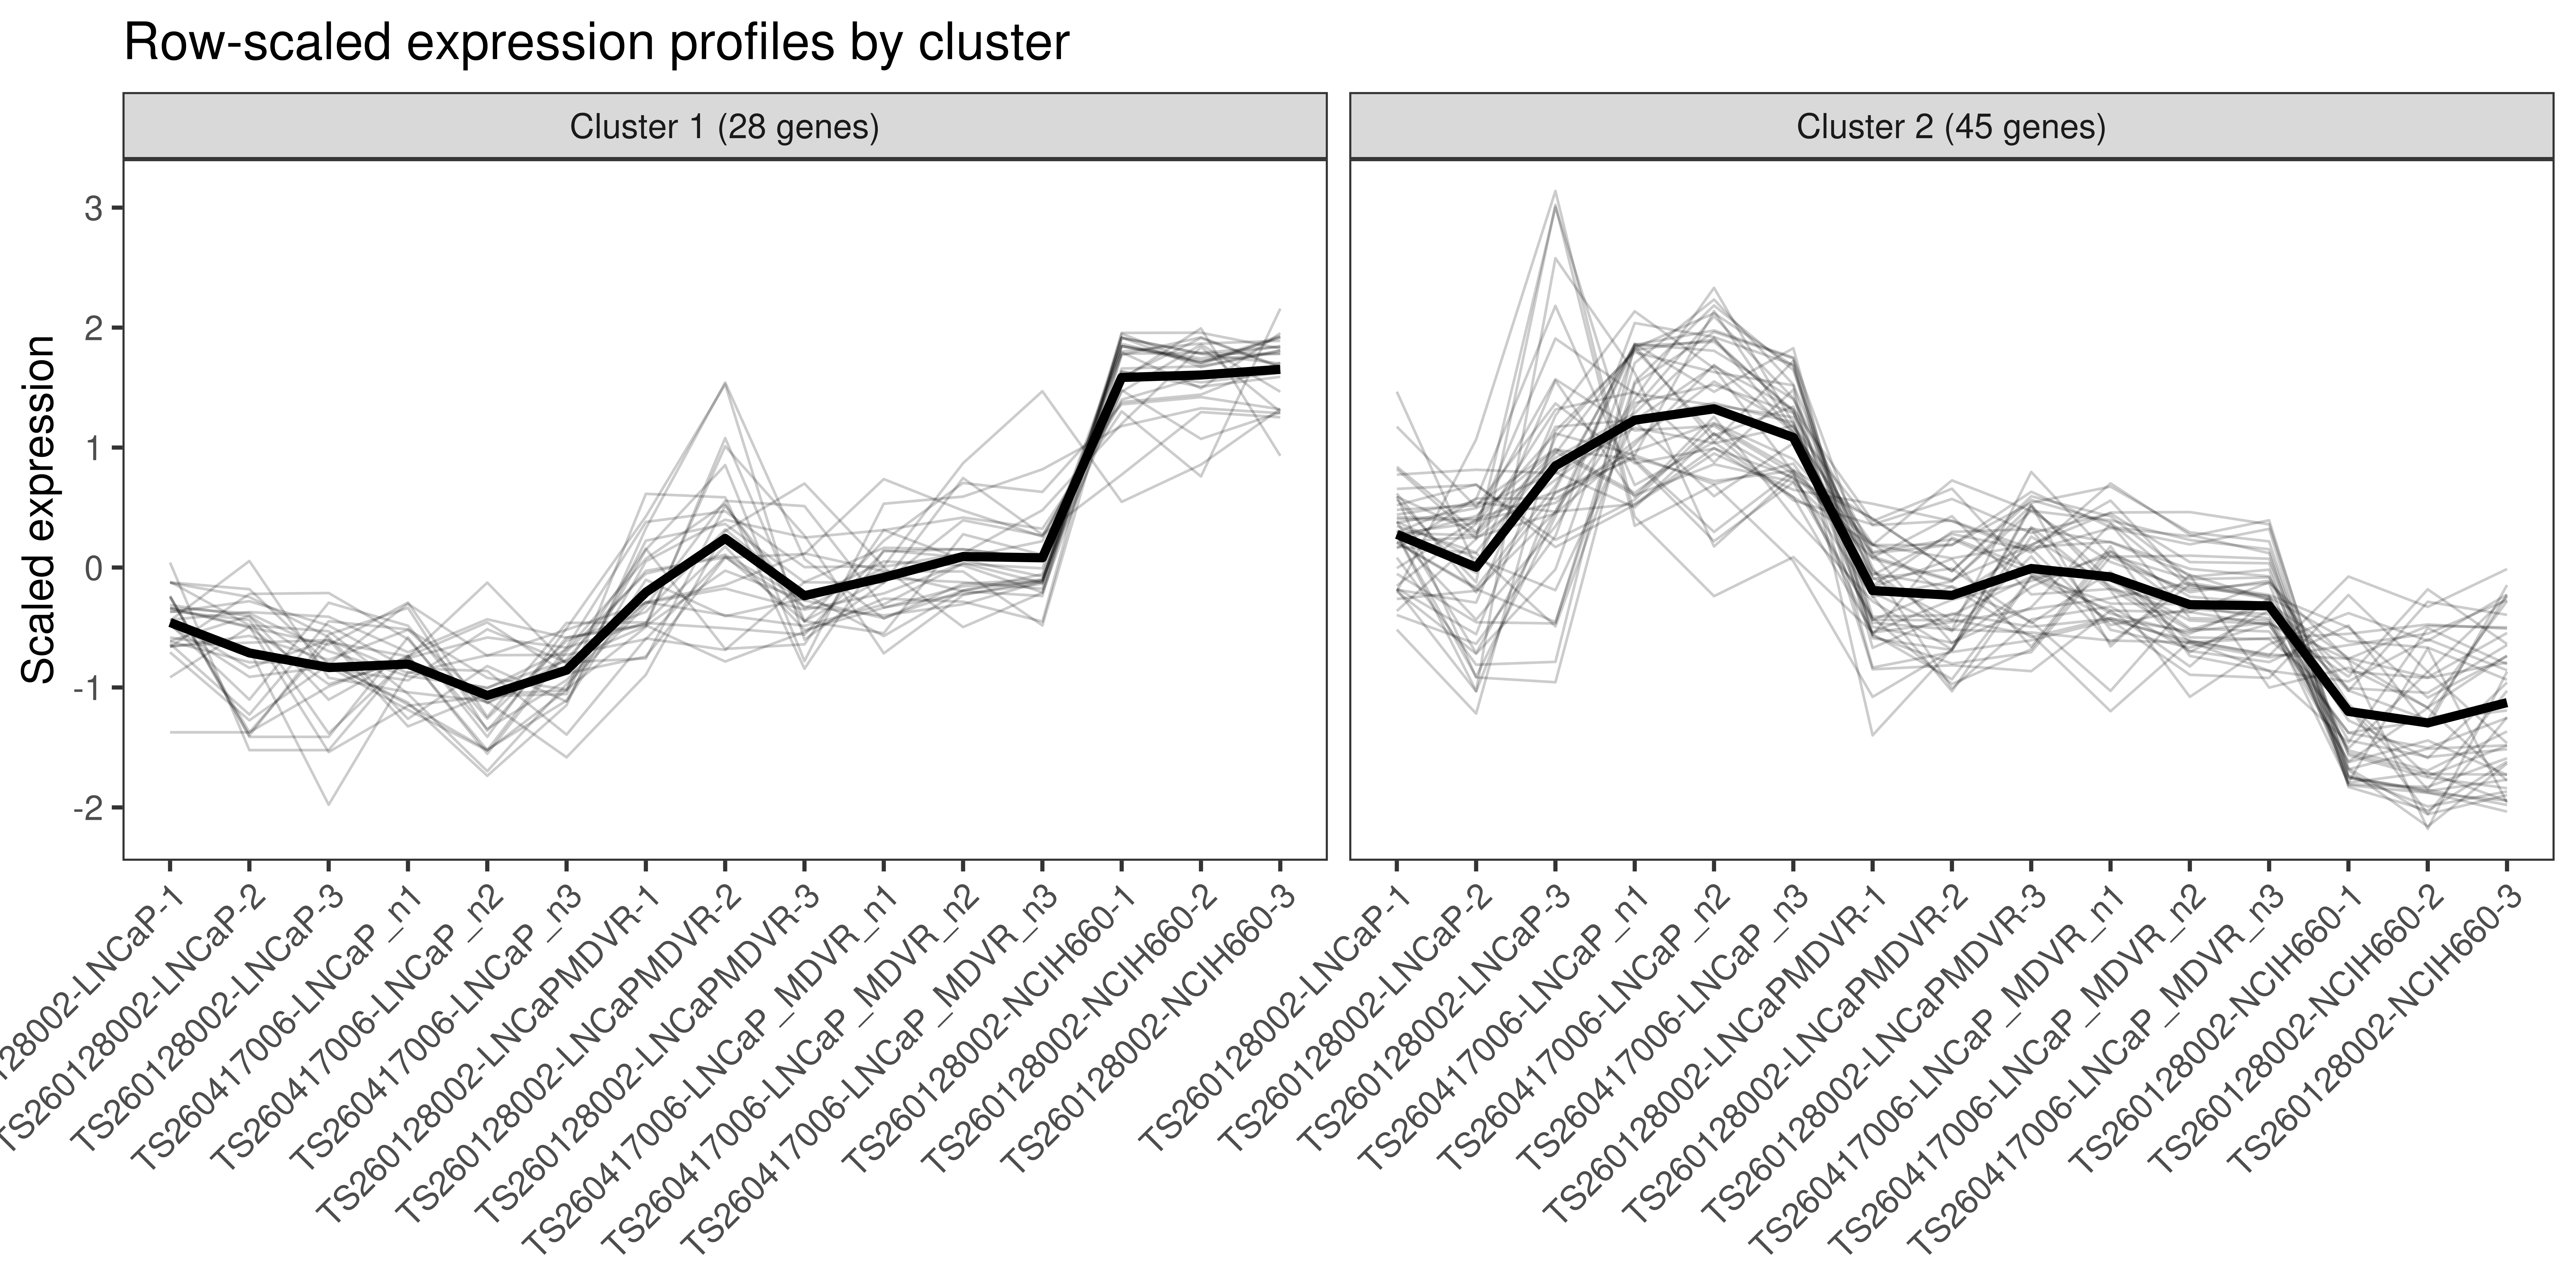
GO ORA for each cluster, before result filtering
- cluster 1: “Requirement_1/ORA_cluster1.csv”
- cluster 2: “Requirement_1/ORA_cluster2.csv”
2. Sample Correlation Heatmap
This heatmap examines the relationships between samples. “Requirement_2/Sample_Correlation.png”
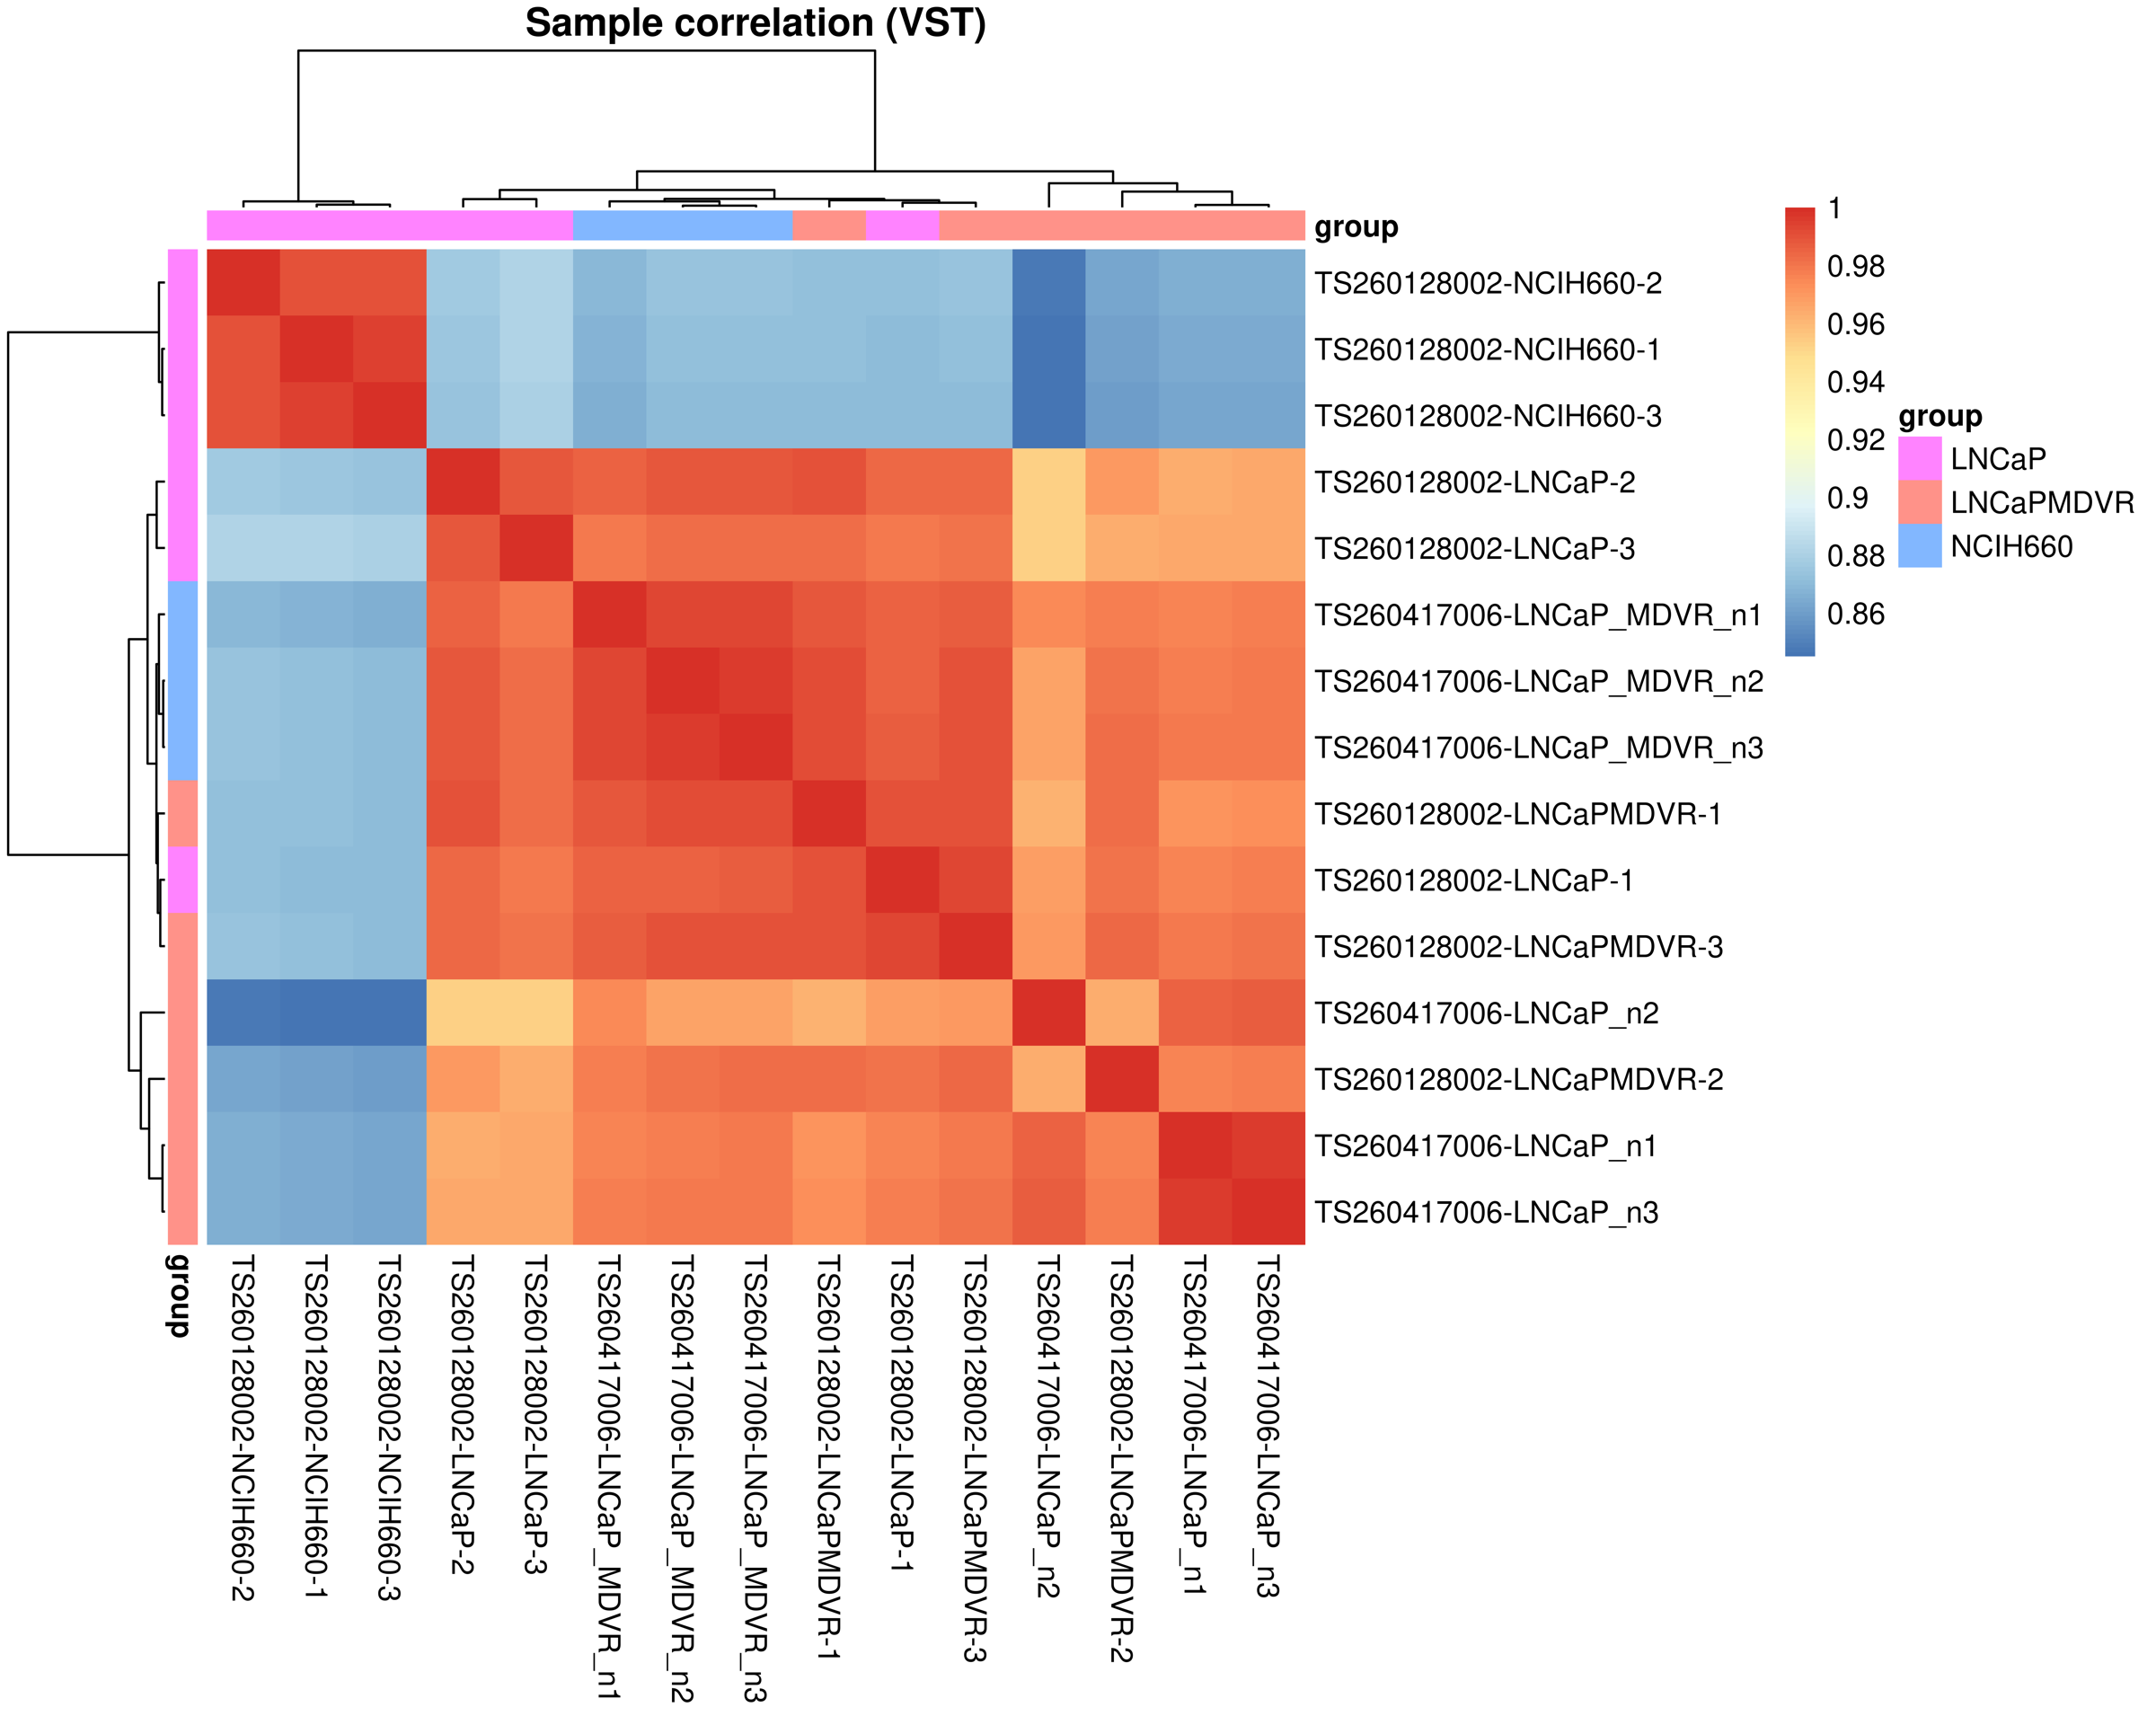
Download original image: Correlation heatmap using all genes across samples
Across all genes, the correlation heatmap did not show LNCaPMDVR to be closer to NCIH660 than LNCaP was.
3. Gene correlation heatmap for the target lipid-gene list: LNCaPMDVR vs. NCIH660
Overview
To examine shared expression patterns among selected lipid-related genes in LNCaPMDVR and NCIH660, I performed gene–gene correlation analysis using a predefined target list. I converted ENSEMBL gene IDs in the VST matrix to gene symbols with clusterProfiler::bitr() and the corresponding OrgDb annotation database. Genes without a SYMBOL mapping were excluded. When one ENSEMBL ID mapped to multiple records, I retained the first mapping.
I retained only genes present in the target lipid-gene list. Repeated gene symbols were assigned unique plotting labels with make.unique() to prevent duplicate row names in the heatmap.
The analysis retained samples from LNCaPMDVR and NCIH660 to evaluate correlations within those two cell lines. Genes with zero standard deviation across the selected samples were removed to avoid undefined Pearson correlations. I then calculated pairwise Pearson correlation coefficients from each gene’s VST-transformed expression values, using pairwise.complete.obs to handle missing values.
I plotted the gene–gene correlation matrix with pheatmap. Both rows and columns represent target lipid genes; each value is the Pearson correlation coefficient between two genes. Hierarchical clustering used Ward’s minimum variance method (ward.D2). Row and column annotations included General_Description as a functional classification to help identify lipid-related gene groups with similar expression patterns.
Lipid Gene List
- 31 genes directly related to lipid metabolism: ACSL, ELOVL, FADS, SGMS, CERS, ACER, ASAH, and SPHK families
- 5 genes related to lipid signaling: S1PR1–S1PR5
- FOXA1/2/3 and AR have indirect or context-dependent relationships; should they be classified as lipid genes?
- POU3F2, SOX3, SYP, and CHGA are closer to transcription factors or neuroendocrine markers than to lipid-specific genes. The list appears to combine fatty acid metabolism, sphingolipid metabolism/signaling, and neuroendocrine or lineage markers, rather than representing a single GO term or KEGG pathway.
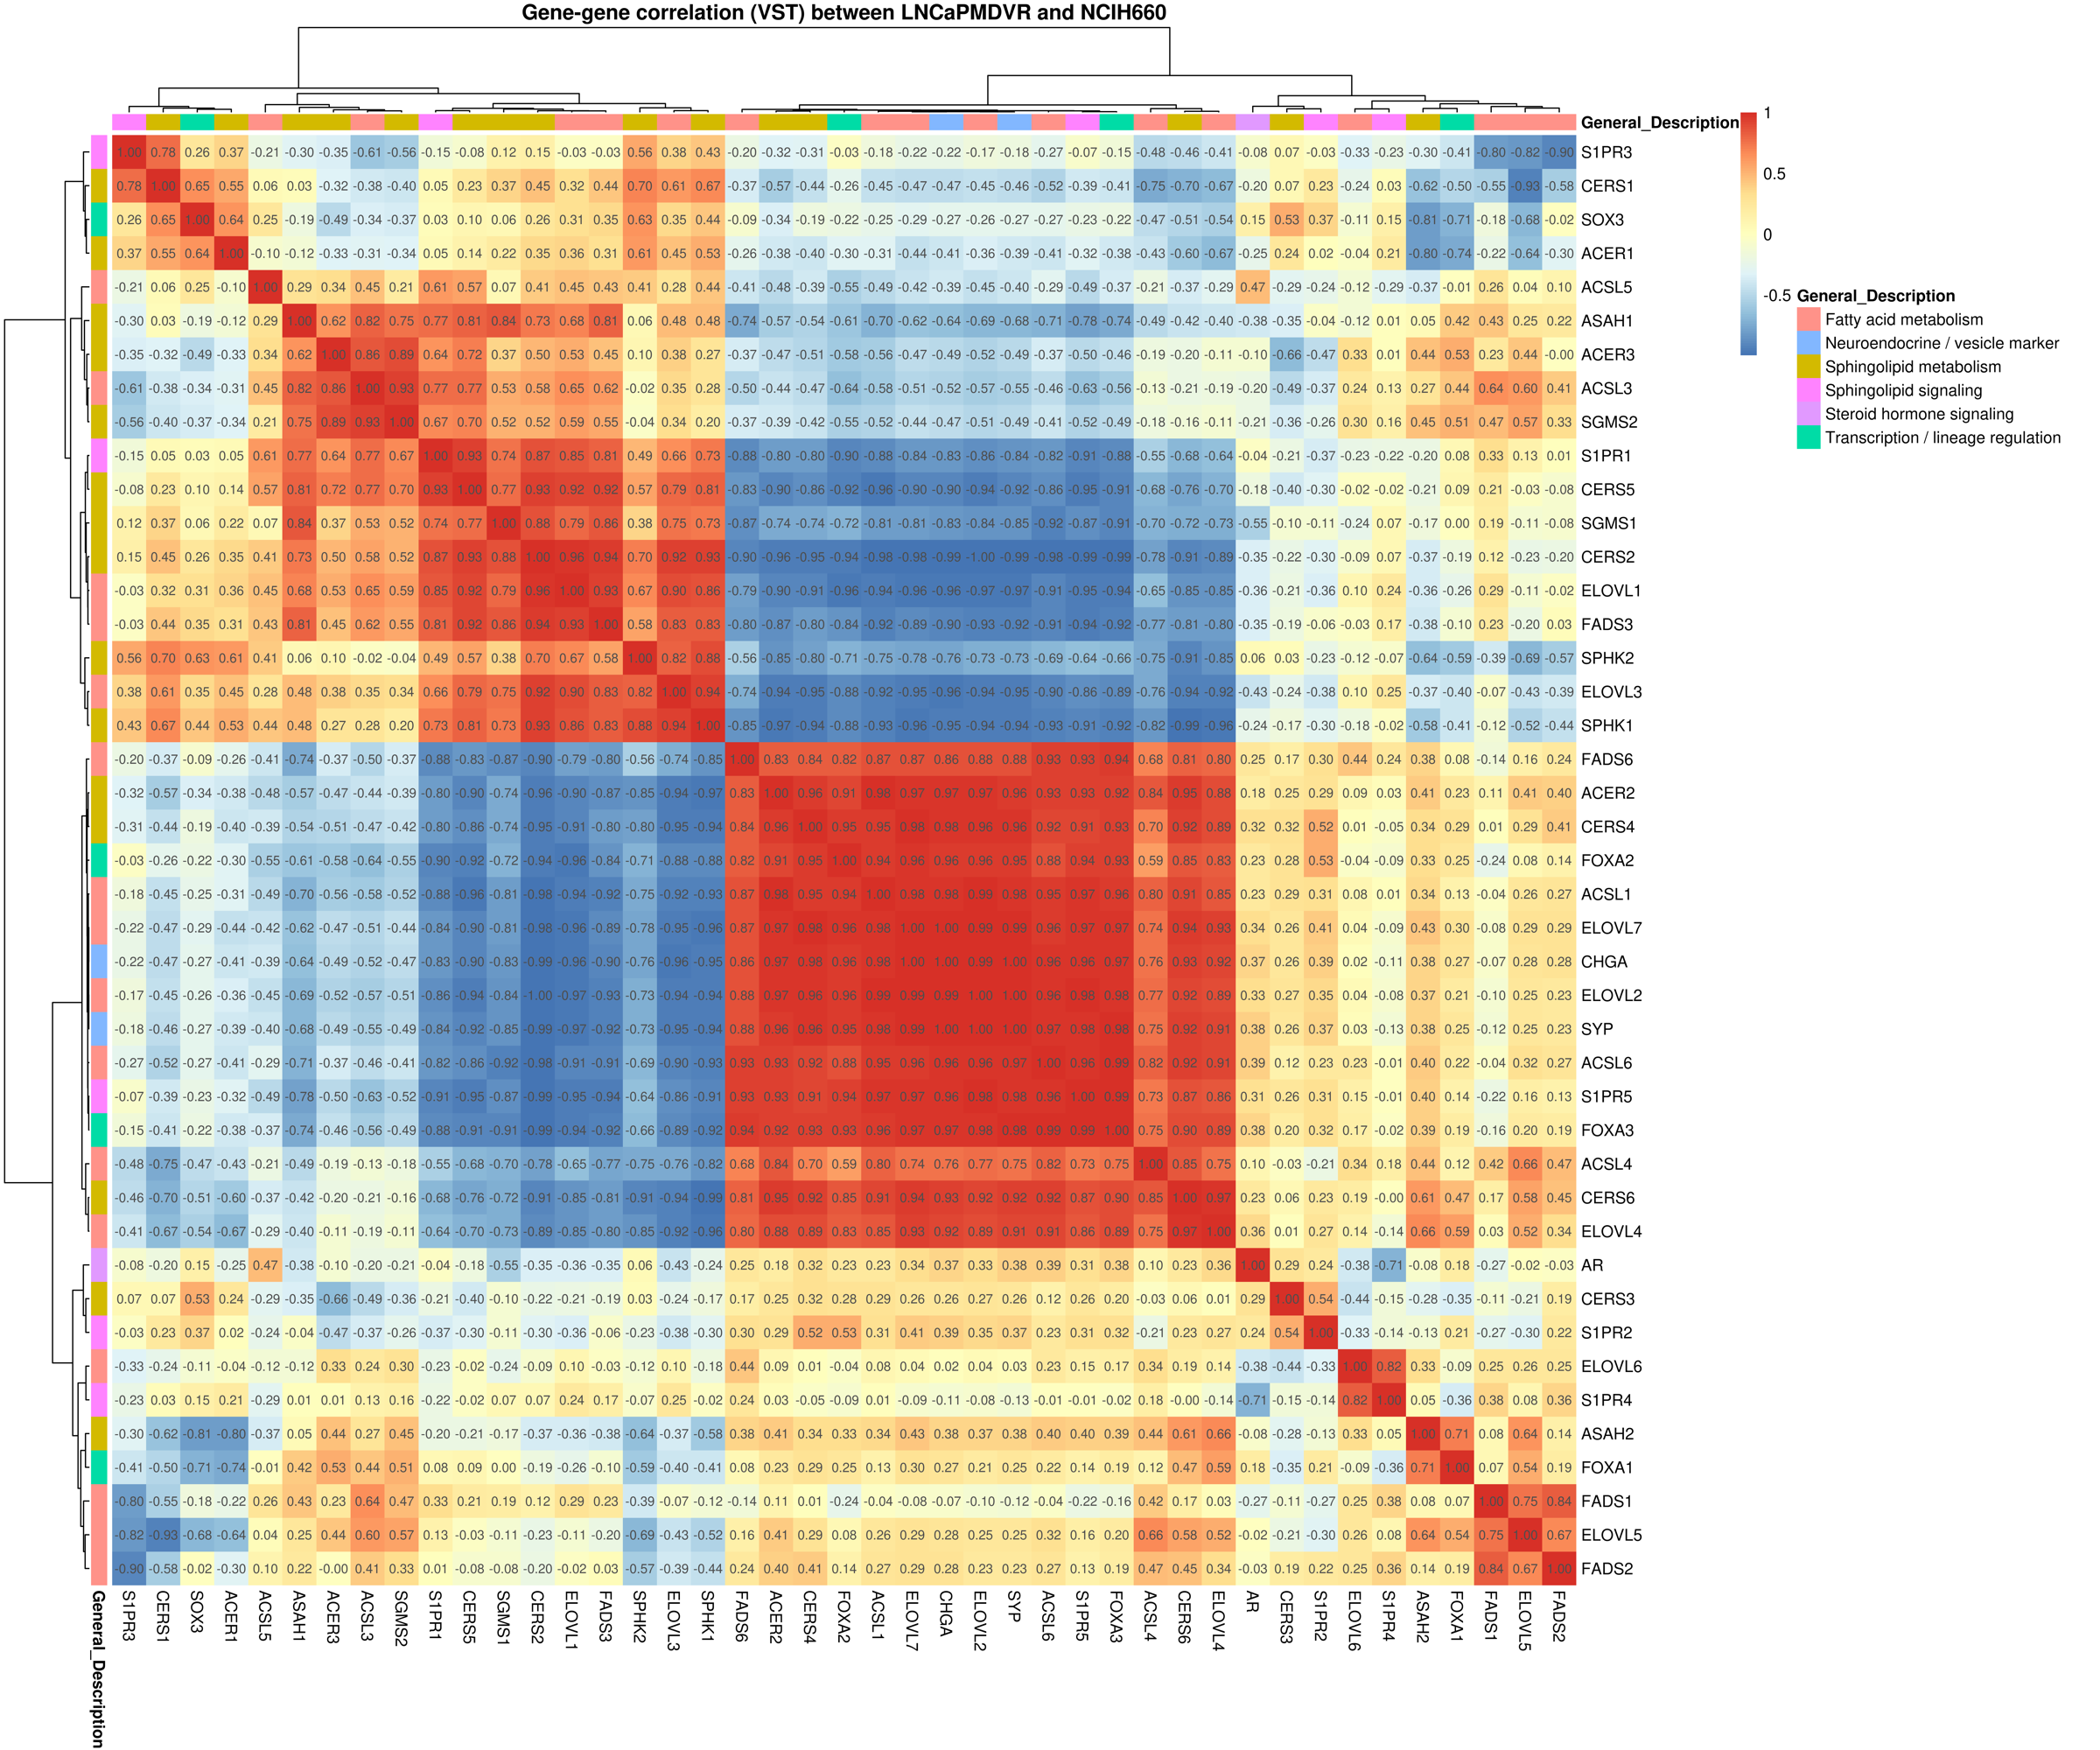
Download original image: Target lipid-gene Pearson correlation heatmap
Interpreting the heatmap
Each cell shows the Pearson correlation coefficient between two target lipid genes across the selected LNCaPMDVR and NCIH660 samples. Coefficients range from -1 to 1.
- Values near 1 indicate similar expression changes across samples: when one gene has higher expression in a sample, the other tends to have higher expression as well.
- Values near 0 indicate no clear linear relationship between the genes’ expression changes in these samples.
- Values near -1 indicate opposing expression patterns: when one gene has higher expression, the other tends to have lower expression. These correlations were calculated from VST-transformed expression values. They describe relative patterns across samples rather than absolute expression abundance. A high correlation does not mean that both genes are highly expressed; it means that their expression changes similarly across the samples.